


XRP (XRPUSD) Is down 1.82% on Aug 28: Here Is Why



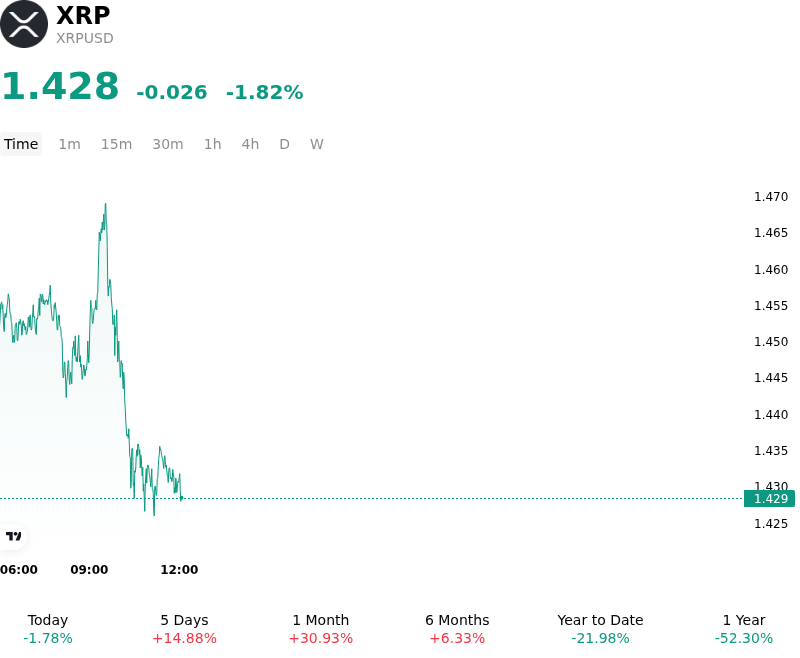
XRP (XRPUSD) is down 1.82% at Aug 28 00:05(ET), now at $1.4279, with a 7-day up of 3.89%.
What is driving XRP (XRPUSD)’s stock price down today?
The intraday downside movement in XRP reflects a wave of profit-taking and leveraged long liquidations following a powerful multi-day rally that tested major technical resistance levels. After significantly outpacing the broader digital asset market in recent sessions, momentum indicators reached overbought territory, leaving the token vulnerable to a temporary unwinding. Aggressive sell-side activity in derivatives markets, marked by a sharp shift in net taker volume and elevated open interest across major exchanges, triggered forced long position closures, amplifying sell-side pressure during the trading session.
Broader macroeconomic liquidity conditions also contributed to the cautious market sentiment. Recent U.S. economic data reinforced higher yield expectations, firming the U.S. dollar and tempering immediate Federal Reserve rate-cut projections. In tandem with high Bitcoin market dominance, which temporarily concentrated available market liquidity into top-tier assets, altcoins experienced broader capital outflows. This macro backdrop encouraged leveraged market participants to reduce risk exposure across high-beta crypto assets.
Despite the derivative-led contraction, underlying spot demand and institutional participation remain constructive. Sustained net inflows into spot XRP investment products highlight persistent institutional accumulation that continues to absorb spot market liquidity. Additionally, ongoing clarity regarding domestic regulatory frameworks and financial infrastructure integration support long-term adoption expectations. The recent move appears to be a leverage reset and short-term profit-taking event within a broader structural trend rather than a breakdown in core market fundamentals.
Technical Analysis of XRP (XRPUSD)
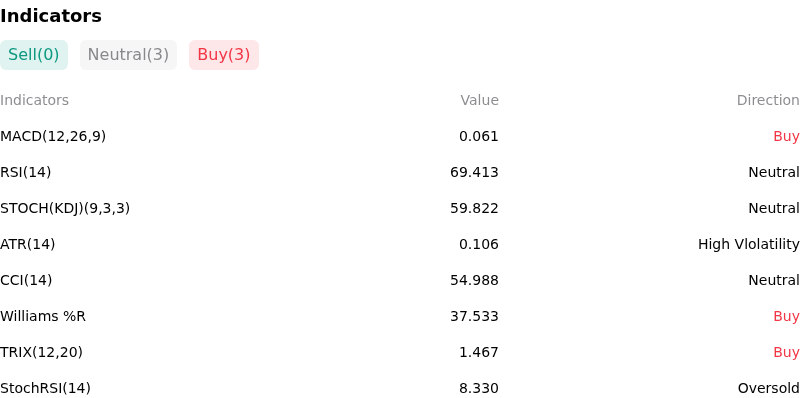
Technically, XRP (XRPUSD) shows a MACD (12,26,9) value of 0.061, indicating a buy signal. The RSI at 69.114 suggests neutral condition and the Williams %R at 37.871 suggests buy condition. Please monitor closely.
More details about XRP (XRPUSD)
Recent Events and Risks:
- Derivatives Leverage Overhang and Long Squeeze: Rapid unwinding of extreme leverage across perpetual futures venues—where leverage ratios reached multi-month highs—has triggered significant long liquidations and pushed net taker volume heavily into negative territory, creating severe downside selling pressure.
- Key Support Breakdown and Technical Rejection: After failing to sustain gains above the major $1.65–$1.70 Fibonacci resistance level, XRP is undergoing a deep technical pullback, with a failure to hold immediate support at $1.40 threatening a deeper cascading correction toward lower structural support around $1.30.
- Legislative Delay on Federal Market Structure: The U.S. Senate's failure to vote on the CLARITY Act prior to recessing has pushed key statutory regulatory votes into September, temporarily removing a major policy catalyst and reintroducing short-term policy uncertainty.
- Broader Market De-risking and Sector Rotation: Macro-driven weakness and liquidations across benchmark assets like Bitcoin following its rejection near key resistance levels have spurred risk-off sentiment, forcing capital rotation away from high-beta altcoins like XRP.
This article may include AI-generated content that is human-reviewed, which is for reference and general information purposes only and does not constitute investment advice.
Recommended Articles










Comments (0)
Click the $ button, enter the symbol, and select to link a stock, ETF, or other ticker.