


General Electric Co Stock (GE) Moved Down by 3.07% on Aug 27: Drivers Behind the Movement



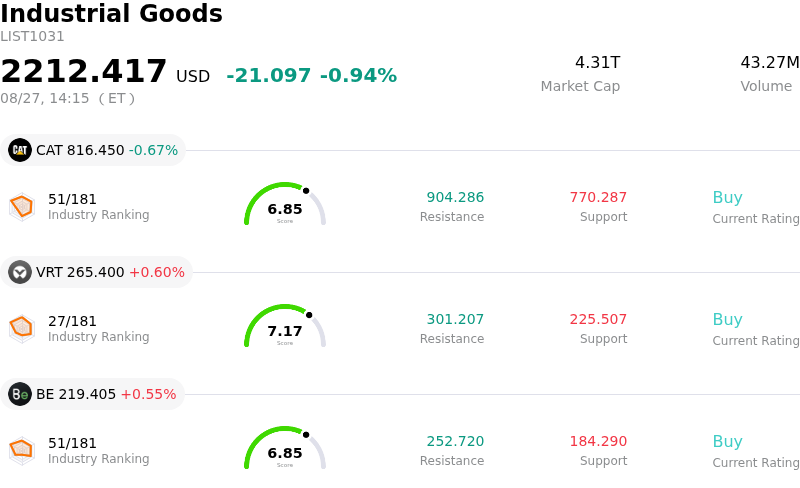
General Electric Co (GE) moved down by 3.07%. The Industrial Goods sector is down by 0.94%. The company underperformed the industry. Top 3 stocks by turnover in the sector: Caterpillar Inc (CAT) down 0.67%; Vertiv Holdings Co (VRT) up 0.56%; Bloom Energy Corp (BE) up 0.55%.
What is driving General Electric Co (GE)’s stock price down today?
The pull-back and intraday volatility in General Electric Aerospace shares can be primarily attributed to valuation friction, margin expansion concerns, and profit-taking following an extended multi-month rally. Although the company recently reported strong quarterly performance—underpinned by robust commercial and defense demand, backlogs exceeding $210 billion, and upwardly revised full-year operating profit guidance—investors are weighing these positive fundamentals against short-term cost pressures and elevated multiples.
A key factor influencing investor sentiment is the ongoing margin pressure driven by cost inflation and aggressive reinvestment. Second-quarter operating profit margins compressed year-over-year as cost of sales surged due to increased production activities, higher input costs, and expanded research and development spending. As GE Aerospace continues to invest heavily in expanding manufacturing capacity, tooling, and supply chain resiliency to meet engine delivery targets, these elevated operational expenses have heightened scrutiny around short-term operating margins and cost containment.
Additionally, valuation considerations have prompted institutional investors to lock in profits. Following a significant share price appreciation over recent months, GE Aerospace trades at a premium forward price-to-earnings multiple compared to its broader aerospace and defense peers. Technical indicators and analyst commentary have pointed to valuation stretch and potential short-term consolidation as the market digests the recent run-up in the stock price. With the market demanding immaculate execution to justify rich earnings multiples, any signals of cost inflation or technical resistance can spark heightened intraday volatility.
Finally, broader market dynamics and portfolio adjustments contributed to the downward movement. Ahead of the traditionally volatile September trading period, institutional investors often rebalance risk assets, leading to profit-taking in top-performing industrial and defense names that have already priced in much of their near-term guidance raises.
Despite these short-term headwinds and price swings, GE Aerospace maintains a solid underlying fundamental foundation, backed by strong engine delivery momentum, aftermarket service demand, and defense contract wins. However, for the stock to resume its upward trajectory, investors will look for evidence of margin recovery and sustained cost efficiency in upcoming quarters.
Technical Analysis of General Electric Co (GE)
Technically, General Electric Co (GE) shows a MACD (12,26,9) value of -5.555, indicating a neutral signal. The RSI at 42.138 suggests neutral condition and the Williams %R at 91.610 suggests oversold condition. Please monitor closely.
Fundamental Analysis of General Electric Co (GE)
General Electric Co (GE) is in the Industrial Goods industry. Its latest annual revenue is $45.85B, ranking 5 in the industry. The net profit is $8.70B, ranking 1 in the industry. Company Profile
Over the past month, multiple analysts have rated the company as Buy, with an average price target of $399.21, a high of $455.00, and a low of $310.22.
More details about General Electric Co (GE)
Company Specific Risks:
- Valuation Multiples and Technical Overextension: Institutional analysts highlight that GE Aerospace trades at a stretched valuation of 35x to 41x forward earnings and a PEG ratio of 2.5x, leaving the equity vulnerable to sharp price pullbacks and technical profit-taking if growth momentum moderates.
- Operational Cost Inflation and Margin Compression: Cost of sales surged 26.7% year-over-year to $8.7 billion alongside a 28.1% spike in R&D expenses, driving a 130 basis point contraction in non-GAAP operating margin down to 21.7% despite top-line expansion.
- Supply Chain Friction and Engine Delivery Bottlenecks: Persistent capacity constraints and raw material shortages within commercial aerospace MRO (maintenance, repair, and overhaul) networks threaten turn-around times and delivery schedules for critical commercial engine programs.
- Insider Share Divestments: SEC regulatory filings detailing executive share liquidations—including Senior Vice President Mohamed Ali reducing direct holdings by over 28%—have fueled institutional concerns regarding top-tier management securing profits near peak pricing levels.
This article may include AI-generated content that is human-reviewed, which is for reference and general information purposes only and does not constitute investment advice.
Recommended Articles









Comments (0)
Click the $ button, enter the symbol, and select to link a stock, ETF, or other ticker.