


Cameco Corp Stock (CCJ) Closed Up by 7.24% on Aug 21: Key Drivers Unveiled



Cameco Corp (CCJ) closed up by 7.24%. The Uranium sector is up by 7.67%. The company underperformed the industry. Top 3 stocks by turnover in the sector: Cameco Corp (CCJ) up 7.24%; Uranium Energy Corp (UEC) up 14.44%; Energy Fuels Inc (UUUU) up 8.92%.
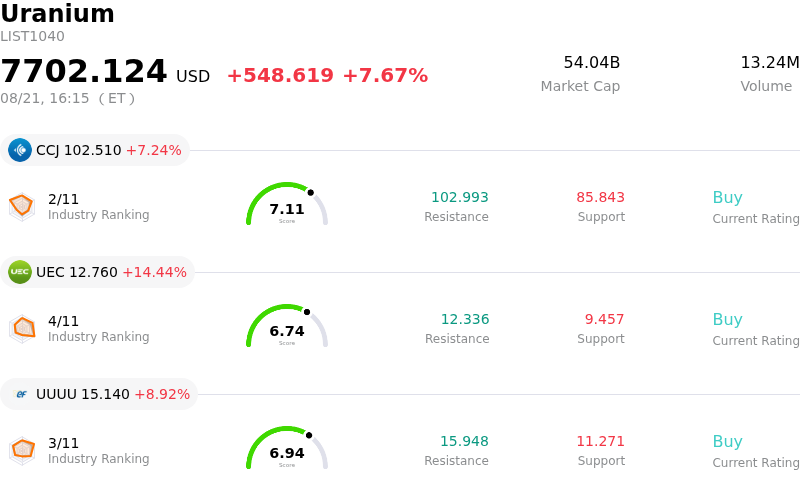
What is driving Cameco Corp (CCJ)’s stock price up today?
The sharp upward momentum in Cameco Corporation shares stems primarily from a renewed wave of investor optimism across the nuclear energy sector, driven by long-term structural demand from data centers and artificial intelligence infrastructure. As major technology companies continuously expand capital expenditures to secure reliable, carbon-free baseload power, primary uranium suppliers are increasingly recognized as critical enablers of the broader energy transition. This secular macro narrative has re-ignited strong dip-buying interest following a brief period of post-earnings consolidation, drawing institutional capital back into Tier-1 nuclear fuel assets.
Beyond overarching industry tailwinds, company-specific strategic catalysts have significantly bolstered market sentiment. Investors are increasingly re-evaluating the latent value within Cameco's reactor services footprint through its joint ownership of Westinghouse Electric Company. Preliminary steps toward a potential Westinghouse initial public offering, combined with substantial United States Department of Energy financial commitments aimed at accelerating new reactor deployments, have led analysts to price in notable sum-of-the-parts value creation. This commercial services exposure offers a high-margin complement to Cameco's core extraction business, expanding recurring revenue channels over the coming decade.
From a fundamental standpoint, the outlook for long-term uranium contracting remains robust. Even as quarterly delivery schedules and temporary site maintenance introduce brief operational lumpiness, average realized contract prices continue to trend significantly higher than historical benchmarks. Global nuclear utilities are proactively locking in multi-year fuel delivery commitments to safeguard against geopolitical supply chain vulnerabilities and Western sanctions on foreign supply. This elevated pricing power allows Cameco to capture expanding profit margins as older, lower-priced contracts systematically roll over into current market rates.
Additionally, positive institutional portfolio adjustments and favorable analyst commentary have accelerated upside momentum. Recent regulatory filings highlighted new position building by prominent investment managers, while Wall Street research reports reaffirmed outperform ratings based on compelling sum-of-the-parts valuations. The convergence of expanding contracting margins, strategic asset monetization opportunities, and aggressive institutional accumulation created a strong buying tailwind, driving a decisive advance during the session.
Technical Analysis of Cameco Corp (CCJ)
Technically, Cameco Corp (CCJ) shows a MACD (12,26,9) value of 1.706, indicating a buy signal. The RSI at 62.028 suggests neutral condition and the Williams %R at 2.540 suggests overbought condition. Please monitor closely.
Fundamental Analysis of Cameco Corp (CCJ)
Cameco Corp (CCJ) is in the Uranium industry. Its latest annual revenue is $2.56B, ranking 1 in the industry. The net profit is $432.97M, ranking 1 in the industry. Company Profile
Over the past month, multiple analysts have rated the company as Buy, with an average price target of $122.81, a high of $175.00, and a low of $80.72.
More details about Cameco Corp (CCJ)
Company Specific Risks:
- Westinghouse Segment Volatility: Recent quarterly results revealed a 42% year-over-year decline in adjusted EBITDA, driven heavily by a sharp drop in equity earnings from Westinghouse, underscoring unpredictable financial performance outside core mining operations.
- Sales Volume Declines and Cost Inflation: Uranium sales volumes fell 18% year-over-year due to lower planned delivery schedules and temporary processing interruptions, while unit costs of sales rose 26%, squeezing operational margins.
- Elevated Valuation Premium: Trading at a forward price-to-sales ratio above 16x—substantially higher than the broader industry average—the stock remains highly vulnerable to sharp intraday sell-offs whenever financial results disappoint expectations.
- Operational and Geopolitical Exposure: The business relies on complex cross-border supply chains, third-party milling operations, and international joint ventures (including operations in Kazakhstan), leaving revenue delivery vulnerable to export restrictions and processing disruptions.
This article may include AI-generated content that is human-reviewed, which is for reference and general information purposes only and does not constitute investment advice.
Recommended Articles











Comments (0)
Click the $ button, enter the symbol, and select to link a stock, ETF, or other ticker.