


Ross Stores Inc Stock (ROST) Moved Up by 5.79% on Aug 21: What Signal Does It Send?



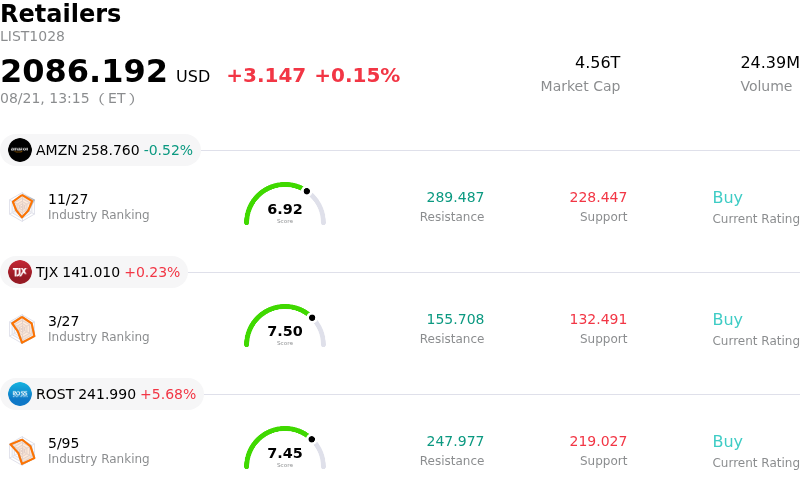
Ross Stores Inc (ROST) moved up by 5.79%. The Retailers sector is up by 0.15%. The company outperformed the industry. Top 3 stocks by turnover in the sector: Amazon.com Inc (AMZN) down 0.52%; TJX Companies Inc (TJX) up 0.23%; Ross Stores Inc (ROST) up 5.68%.
What is driving Ross Stores Inc (ROST)’s stock price up today?
Ross Stores experienced a notable upward movement following the release of its second-quarter fiscal 2026 financial results, which significantly surpassed Wall Street expectations on both top-line revenue and bottom-line earnings. Growth was anchored by strong comparable-store sales, driven primarily by robust customer foot traffic. Value-conscious consumers increasingly gravitated toward off-price retail options amid a challenging macroeconomic backdrop, allowing the company to expand its customer base and capture market share across diverse demographic groups and product categories.
Profitability expanded substantially during the quarter, supported by merchandise margin improvements, lower distribution costs, and a sizable benefit from tariff refunds. Even excluding the tariff refund impact, core operating margins showed solid year-over-year improvement, underscoring effective inventory management and disciplined operational execution. Management subsequently raised its financial guidance for the second half of the year as well as full-year earnings per share expectations, while also increasing its full-year store opening targets and reaffirming its share buyback commitment.
The strong quarterly execution and optimistic forward guidance prompted several major Wall Street brokerages to raise their price targets on the stock. Investors reacted favorably to the retailer's clear competitive momentum relative to industry peers and its ability to sustain transaction-led sales growth. This combination of earnings outperformance, margin expansion, and upgraded full-year outlook served as the primary driver of the positive market sentiment and upward stock trajectory.
Technical Analysis of Ross Stores Inc (ROST)
Technically, Ross Stores Inc (ROST) shows a MACD (12,26,9) value of -5.226, indicating a neutral signal. The RSI at 51.379 suggests neutral condition and the Williams %R at 50.915 suggests neutral condition. Please monitor closely.
Media Coverage of Ross Stores Inc (ROST)
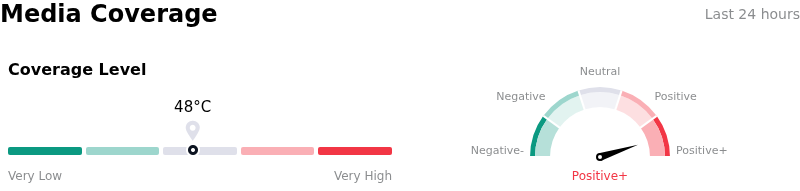
In terms of media coverage, Ross Stores Inc (ROST) shows a coverage score of 48, indicating a moderate level of media attention. The overall market sentiment index is currently in extremely bullish zone.
Fundamental Analysis of Ross Stores Inc (ROST)
Ross Stores Inc (ROST) is in the Retailers industry. Its latest annual revenue is $22.75B, ranking 8 in the industry. The net profit is $2.15B, ranking 5 in the industry. Company Profile
Over the past month, multiple analysts have rated the company as Buy, with an average price target of $256.40, a high of $290.00, and a low of $172.78.
More details about Ross Stores Inc (ROST)
Company Specific Risks:
- One-Time Tariff Refund Distorting Earnings Quality: According to the company's August 20, 2026 Form 8-K filing, $0.60 per share ($253 million) of second-quarter EPS was driven by a non-recurring IEEPA tariff refund, which artificially expanded operating margins by 405 basis points and masked core operational earnings power.
- Sequential Comparable Store Sales Deceleration: Management's second-half fiscal 2026 guidance projects same-store sales growth to decelerate sharply from 10% in Q2 to 6%–7% in Q3 and 4%–5% in Q4, signaling potential top-line growth headwinds for the remainder of the fiscal year.
- Elevated Valuation and Analyst Cautiousness: Following post-earnings price appreciation, Wall Street analysts at firms such as UBS cautioned that the stock's valuation multiple already reflects optimistic multi-year earnings growth, leaving the stock trading near or above updated price targets and vulnerable to valuation resets.
- Macroeconomic Retail Softness and Sector Volatility: Recent broader retail sales data showing a 0.6% month-over-month decline in July, paired with sluggish performance from off-price competitors, highlights lingering pressure on value-seeking consumers that could impact store traffic in upcoming quarters.
This article may include AI-generated content that is human-reviewed, which is for reference and general information purposes only and does not constitute investment advice.
Recommended Articles











Comments (3)
Click the $ button, enter the symbol, and select to link a stock, ETF, or other ticker.