


Interactive Brokers Group Inc Stock (IBKR) Moved Up by 3.06% on Aug 21: What Signal Does It Send?



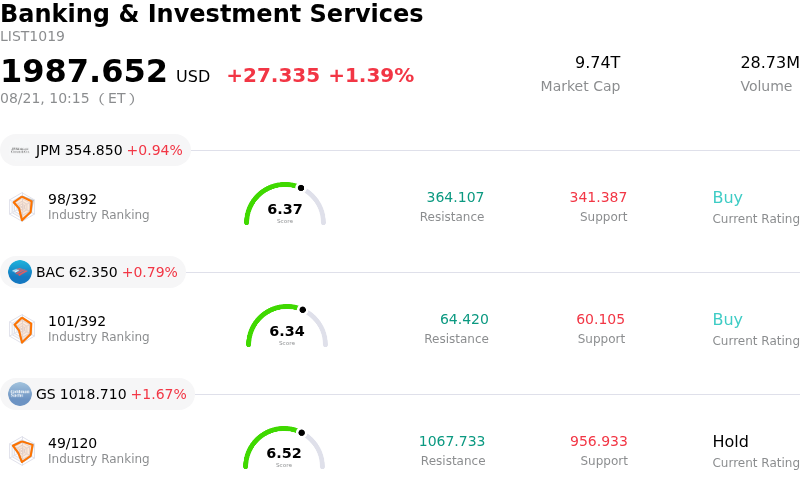
Interactive Brokers Group Inc (IBKR) moved up by 3.06%. The Banking & Investment Services sector is up by 1.39%. The company outperformed the industry. Top 3 stocks by turnover in the sector: JPMorgan Chase & Co (JPM) up 0.94%; Bank of America Corp (BAC) up 0.78%; Goldman Sachs Group Inc (GS) up 1.67%.
What is driving Interactive Brokers Group Inc (IBKR)’s stock price up today?
Interactive Brokers Group demonstrated notable upward momentum as dip-buying interest surfaced following recent short-term pullbacks. Market participants appeared to look past recent debates surrounding elevated valuation multiples, refocusing instead on the brokerage's outstanding operating metrics and steady underlying revenue drivers. Strong capital market activity and elevated trading volumes across global asset classes continue to provide a constructive backdrop for electronic trading platforms.
A key factor fueling positive institutional sentiment is the company's continuous expansion in customer accounts and margin balance growth. Rapid growth in customer margin debt provides a significant boost to net interest income, strengthening overall earning power. Higher client equity levels, combined with elevated daily average revenue trades, underscore the platform's ability to capture expanding market share among sophisticated individual investors and institutional clients alike.
Operational momentum is further bolstered by strategic platform enhancements aimed at international expansion. Recent rollouts granting clients direct trading access to additional emerging global exchanges and localized funding integrations in high-growth regions like Latin America continue to broaden the company's total addressable market. These developments enhance platform usability and reinforce customer retention across key international demographics.
Broader market conditions also played a supporting role, as constructive equity market sentiment and sustained trading velocity encouraged inflows into leading brokerages. Given the firm's lean cost structure and high pretax operating margins, incremental revenue growth translates efficiently into earnings expansion. While broader market volatility remains present, strong fundamental metrics and structural franchise expansion continue to attract investor demand.
Technical Analysis of Interactive Brokers Group Inc (IBKR)
Technically, Interactive Brokers Group Inc (IBKR) shows a MACD (12,26,9) value of 0.469, indicating a neutral signal. The RSI at 53.785 suggests neutral condition and the Williams %R at 23.077 suggests buy condition. Please monitor closely.
Fundamental Analysis of Interactive Brokers Group Inc (IBKR)
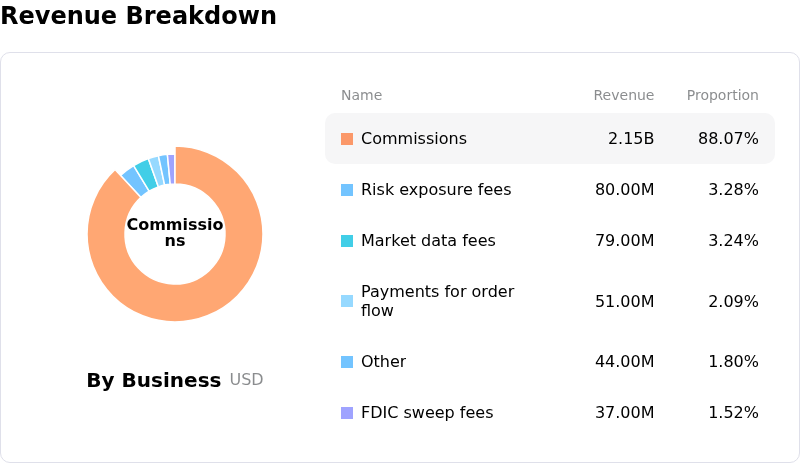
Interactive Brokers Group Inc (IBKR) is in the Banking & Investment Services industry. Its latest annual revenue is $10.00B, ranking 24 in the industry. The net profit is $984.00M, ranking 24 in the industry. Company Profile
Over the past month, multiple analysts have rated the company as Buy, with an average price target of $106.31, a high of $121.00, and a low of $72.18.
More details about Interactive Brokers Group Inc (IBKR)
Company Specific Risks:
- Valuation Compression and Premium Multiples: Institutional research and recent analyst commentary underscore that IBKR trades at a trailing P/E of roughly 36.2x—substantially above its 5-year median of 21.5x and peer averages—leaving the shares vulnerable to downside repricing if revenue or account growth decelerates.
- Net Interest Margin Compression Vulnerability: Macroeconomic rate shifts and tighter credit conditions threaten Interactive Brokers' core profitability by putting pressure on net interest income—its largest revenue component—while operating costs and technology investments continue to escalate.
- Insider Net Selling and Equity Dilution Overhang: Recent regulatory filings and tracking data reveal net insider selling totaling nearly $99 million alongside Class A share registration filings for promotional grants and IBG LLC unit exchanges, creating persistent market supply overhang.
- Trading Volume Sensitivity to Macro Headwinds: Market volatility and cautious retail investor engagement driven by higher yields directly threaten Daily Active Revenue Trades (DARTs) and commission revenue, compounding near-term intraday downward momentum.
This article may include AI-generated content that is human-reviewed, which is for reference and general information purposes only and does not constitute investment advice.
Recommended Articles











Comments (0)
Click the $ button, enter the symbol, and select to link a stock, ETF, or other ticker.