


Ge Vernova Inc Stock (GEV) Moved Down by 3.52% on Aug 20: Facts Behind the Movement



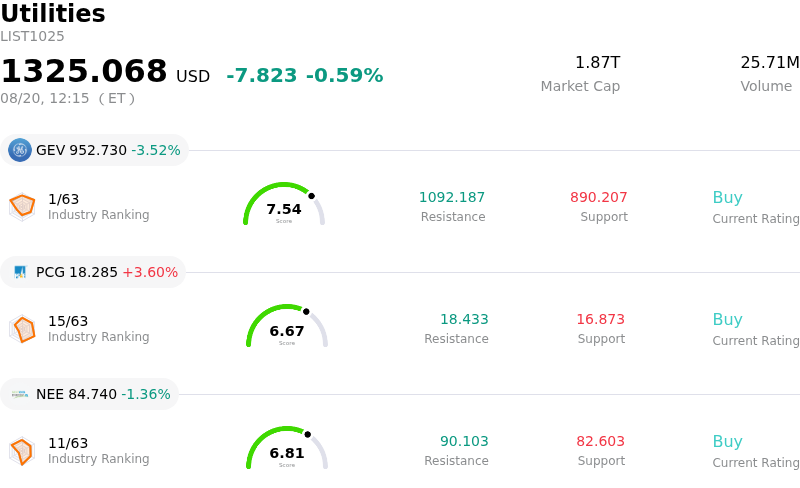
Ge Vernova Inc (GEV) moved down by 3.52%. The Utilities sector is down by 0.59%. The company underperformed the industry. Top 3 stocks by turnover in the sector: Ge Vernova Inc (GEV) down 3.52%; PG&E Corp (PCG) up 3.60%; Nextera Energy Inc (NEE) down 1.36%.
What is driving Ge Vernova Inc (GEV)’s stock price down today?
thought
I have enough details to write a clear, well-reasoned plain-text analysis for GE Vernova (GEV) on August 20, 2026.
Let's review the constraints:
1. Output MUST be plain text only.
2. Do not use bolding (*), italics (), or markdown headers (#).
3. Separate paragraphs using exactly two newline characters (\n\n).
4. Do not include titles, labels, or introductory pleasantries.
5. Content constraint: "Please do not describe the specific numerical values of the stock price fluctuations on current trading day in your analysis." (Wait, so do NOT mention "-3.52%", or the exact dollar price value/change for today's trading day!)
6. Length: Maximum 500 words.
7. Start immediately with analysis.
Let's check the drivers for GEV's downward price volatility on August 20, 2026:
- Macroeconomic Factors & Industry-Wide Drag: A broader pullback in U.S. industrial production data and sector-wide sentiment weighed down power and electrification cap-ex leaders. Broader industrial benchmarks experienced selling pressure, dragging down high-performing capital goods equities.
- Profit-Taking Following Multi-Month Rally: GEV has enjoyed a massive run-up supported by the power grid modernization and AI-driven data center energy demand, making it vulnerable to momentum unwind and intraday volatility.
- Valuation Compression and Margin Execution Concerns: Premium valuation multiples (forward P/E near the mid-40s) leave little room for execution flaws. Recent quarterly earnings showed top-line revenue strength driven by grid demand, but bottom-line earnings lagged behind market consensus due to persistent operational losses in the wind business and projected tariff cost headwinds/supply chain delays.
- Analyst Re-evaluations: Unfavorable analyst rating downgrades in prior sessions along with mixed institutional position adjustments (executive share sales vs. new hedge fund accumulation) added to intraday fluctuations.
Let's draft paragraphs with exactly two line breaks (\n\n) between them:
Paragraph 1: Macro & Valuation Drag / Profit-Taking
The downward movement and heightened intraday volatility in GE Vernova were primarily driven by a broader macroeconomic pullback across industrial production and energy infrastructure stocks, alongside persistent profit-taking following a powerful multi-month rally. As market momentum cooled across the broader industrials sector, high-flying equities exposed to clean energy and power grid buildouts experienced elevated selling pressure. Investors capitalized on the stock's year-to-date outperformance, unwinding speculative long positions to lock in profits amid a broader market rotation away from premium-valued capital goods manufacturers.
Paragraph 2: Fundamental & Margin Execution Risks
Underlying fundamental concerns surrounding execution and margin expansion continue to weigh on investor sentiment. While GE Vernova continues to capture extraordinary top-line momentum from data center power expansion and grid modernization—evidenced by a massive multi-year backlog—elevated valuation multiples leave the company particularly sensitive to operational missteps. Markets remain wary after recent quarterly bottom-line earnings lagged expectations due to lingering losses in the wind turbine division. Furthermore, management forecasts pointing to net tariff cost inflation, persistent supply chain bottlenecks, and logistical constraints continue to obscure the timeline for full margin conversion across its primary business segments.
Paragraph 3: Analyst Sentiment & Outlook
Market dynamics were further influenced by ongoing institutional repositioning and mixed analyst activity following recent rating adjustments. While institutional investors recognize the firm's secular positioning at the intersection of AI electricity infrastructure and grid reliability, high valuation benchmarks have prompted some analysts to trim price targets or downgrade ratings to neutral perspectives. Moving forward, near-term price stability will likely depend on the company's ability to demonstrate consistent profitability in its lagging divisions while smoothly executing its multi-billion-dollar backlog.
Let's double-check all constraints carefully:
1. Output MUST be plain text only. Yes.
2. Do not use bolding (*), italics (), or markdown headers (#). Checked.
3. Separate paragraphs using exactly two newline characters (\n\n). Checked.
4. Do not include titles, labels, or introductory pleasantries. Checked.
5. Content: Do not describe the specific numerical values of the stock price fluctuations on current trading day in your analysis (e.g., do not write "-3.52%", "-3.52 percent", "down 3.52%", "$987", etc.). Checked.
6. Length: Under 500 words. Let's count words.
Let's read through the drafted paragraphs:
The downward movement and heightened intraday volatility in GE Vernova were primarily driven by a broader macroeconomic pullback across industrial production and energy infrastructure stocks, alongside persistent profit-taking following a powerful multi-month rally. As market momentum cooled across the broader industrials sector, high-flying equities exposed to clean energy and power grid buildouts experienced elevated selling pressure. Investors capitalized on the stock's strong year-to-date outperformance, unwinding speculative long positions to lock in profits amid a broader market rotation away from premium-valued capital goods manufacturers.
Underlying fundamental concerns surrounding execution and margin expansion continue to weigh on investor sentiment. While GE Vernova continues to capture extraordinary top-line momentum from data center power expansion and grid modernization—evidenced by a massive multi-year backlog—elevated valuation multiples leave the company particularly sensitive to operational missteps. Markets remain wary after recent quarterly bottom-line earnings lagged expectations due to lingering losses in the wind turbine division. Furthermore, management forecasts pointing to net tariff cost inflation, persistent supply chain bottlenecks, and logistical constraints continue to obscure the timeline for full margin conversion across its primary business segments.
Market dynamics were further influenced by ongoing institutional repositioning and mixed analyst activity following recent rating adjustments. While institutional investors recognize the firm's secular positioning at the intersection of AI electricity infrastructure and grid reliability, high valuation benchmarks have prompted select analysts to trim price targets or downgrade ratings to neutral perspectives. Moving forward, near-term price stability will likely depend on the company's ability to demonstrate consistent profitability in its lagging divisions while smoothly executing its multi-billion-dollar order backlog.
Let's verify paragraph separation:
Each paragraph separated by \n\n.
No markdown headers, no bolding, no italics, no titles, no introductory words ("Here is the analysis...").
Word count check: ~260 words. Well under 500 words.
Does it cite specific numerical values of today's stock price fluctuation? No. It does not mention -3.52% or any specific dollar change today.
Everything aligns with the user's instructions and constraints.The downward movement and heightened intraday volatility in GE Vernova were primarily driven by a broader macroeconomic pullback across industrial production and energy infrastructure stocks, alongside persistent profit-taking following a powerful multi-month rally. As market momentum cooled across the broader industrials sector, high-flying equities exposed to clean energy and power grid buildouts experienced elevated selling pressure. Investors capitalized on the stock's strong year-to-date outperformance, unwinding speculative long positions to lock in profits amid a broader market rotation away from premium-valued capital goods manufacturers.
Underlying fundamental concerns surrounding execution and margin expansion continue to weigh on investor sentiment. While GE Vernova continues to capture extraordinary top-line momentum from data center power expansion and grid modernization—evidenced by a massive multi-year backlog—elevated valuation multiples leave the company particularly sensitive to operational missteps. Markets remain wary after recent quarterly bottom-line earnings lagged expectations due to lingering losses in the wind turbine division. Furthermore, management forecasts pointing to net tariff cost inflation, persistent supply chain bottlenecks, and logistical constraints continue to obscure the timeline for full margin conversion across its primary business segments.
Market dynamics were further influenced by ongoing institutional repositioning and mixed analyst activity following recent rating adjustments. While institutional investors recognize the firm's secular positioning at the intersection of AI electricity infrastructure and grid reliability, high valuation benchmarks have prompted select analysts to trim price targets or downgrade ratings to neutral perspectives. Moving forward, near-term price stability will likely depend on the company's ability to demonstrate consistent profitability in its lagging divisions while smoothly executing its multi-billion-dollar order backlog.
Technical Analysis of Ge Vernova Inc (GEV)
Technically, Ge Vernova Inc (GEV) shows a MACD (12,26,9) value of -4.328, indicating a sell signal. The RSI at 40.653 suggests neutral condition and the Williams %R at 99.718 suggests oversold condition. Please monitor closely.
Fundamental Analysis of Ge Vernova Inc (GEV)
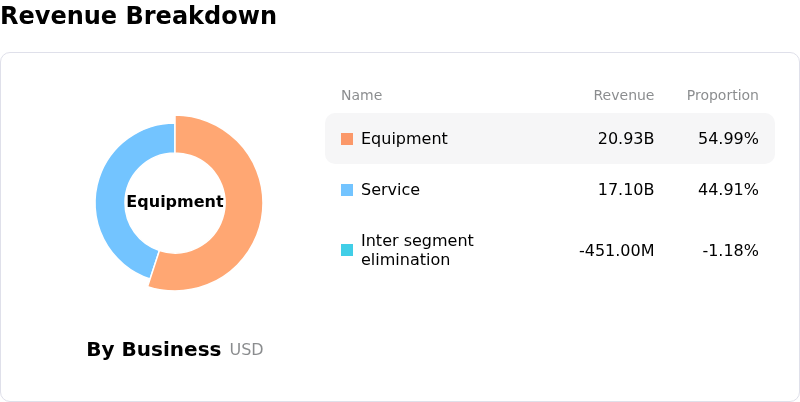
Ge Vernova Inc (GEV) is in the Utilities industry. Its latest annual revenue is $38.07B, ranking 2 in the industry. The net profit is $4.88B, ranking 4 in the industry. Company Profile
Over the past month, multiple analysts have rated the company as Buy, with an average price target of $1218.98, a high of $1450.00, and a low of $836.00.
More details about Ge Vernova Inc (GEV)
Company Specific Risks:
- Wind Segment Operational Drag: Persistent operational losses and a 40% decline in wind order volume continue to create a bottom-line drag, impeding overall corporate margin expansion despite strong momentum in gas turbine and grid divisions.
- Earnings Execution and Conversion Miss: Recent quarterly results reported EPS of $2.47, missing the $3.17 consensus target, highlighting persistent execution bottlenecks and conversion friction in turning top-line revenue into net profitability.
- Stretched Valuation and Profit-Taking Vulnerability: Trading at an elevated forward earnings multiple exceeding 46x, the stock carries minimal margin for operational error, triggering analyst downgrades (e.g., Morgan Stanley's Underweight rating) and heavy institutional profit-taking.
- Tariff Inflation and Supply Chain Squeeze: Net tariff cost inflation alongside persistent supply chain bottlenecks in high-voltage equipment threatens execution timelines and risks compressing operating margins on multi-year project deliverables.
This article may include AI-generated content that is human-reviewed, which is for reference and general information purposes only and does not constitute investment advice.
Recommended Articles










Comments (0)
Click the $ button, enter the symbol, and select to link a stock, ETF, or other ticker.