


Eli Lilly and Co Stock (LLY) Moved Up by 3.19% on Aug 18: What Signal Does It Send?



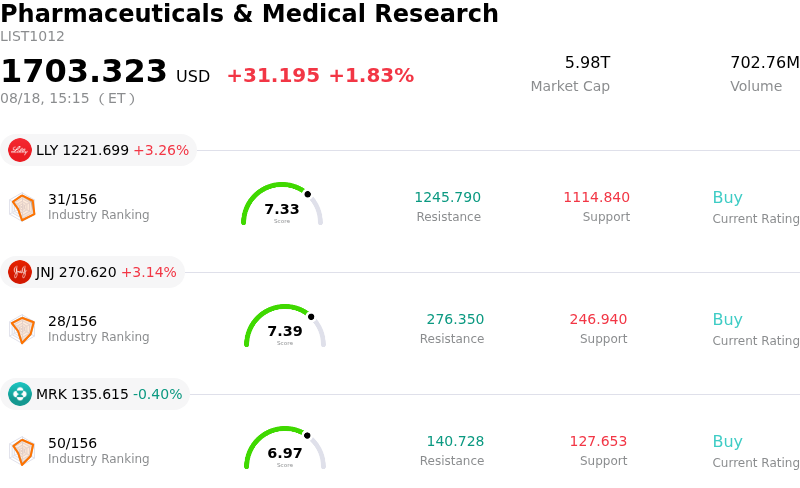
Eli Lilly and Co (LLY) moved up by 3.19%. The Pharmaceuticals & Medical Research sector is up by 1.83%. The company outperformed the industry. Top 3 stocks by turnover in the sector: Eli Lilly and Co (LLY) up 3.19%; Johnson & Johnson (JNJ) up 3.12%; Merck & Co Inc (MRK) down 0.40%.
What is driving Eli Lilly and Co (LLY)’s stock price up today?
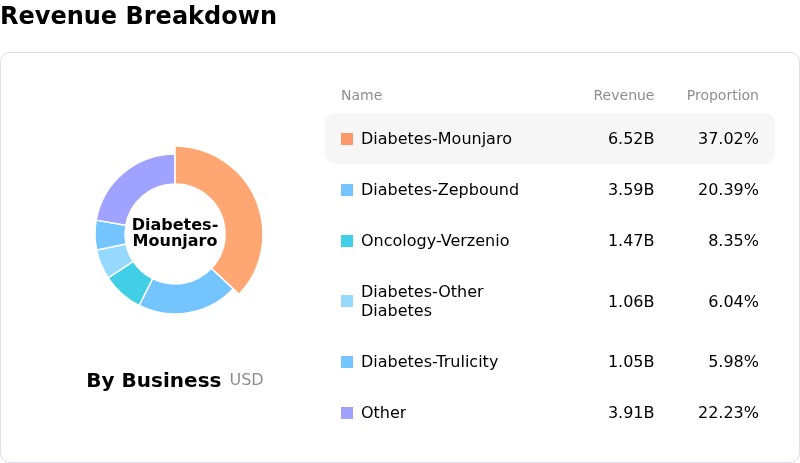
Eli Lilly experienced positive price action fueled by sustained momentum following its robust second-quarter earnings report and an upward revision to its full-year financial outlook. Strong demand for key therapeutic franchises, particularly tirzepatide-based treatments Mounjaro for type 2 diabetes and Zepbound for weight management, continues to surpass market expectations. The company's top-line revenue and bottom-line earnings significantly outpaced Wall Street estimates, reinforcing investor confidence in its capacity to expand manufacturing capacity and capture market share in the rapidly expanding metabolic and obesity drug sector. Upward earnings estimate revisions from analysts over recent weeks have further supported the upward trajectory.
Beyond historical quarterly performance, long-term valuation assessments and enthusiasm surrounding Eli Lilly's advanced clinical pipeline provided an additional boost. Investors remain focused on late-stage clinical trials for next-generation treatments, including its triple-agonist candidate retatrutide and oral small-molecule GLP-1 therapies. Strategic research reports published in the market highlighted the company's strong long-term cash flow generation potential relative to intrinsic value estimates, assuring market participants that the company's multi-year growth story remains intact despite trading at a valuation premium compared to broader pharmaceutical industry peers.
Intraday trading was marked by heightened volatility as institutional investors digested recent regulatory disclosures, executive insider sales executed under pre-arranged trading plans, and broader sector rotation. Portfolio rebalancing following quarterly filings led to sharp price swings throughout the day as market participants weighed elevated short-term valuation metrics against durable long-term expansion opportunities. Nevertheless, strong fundamental backing across the core diabetes, obesity, and neuroscience portfolios allowed buyers to absorb intraday pullbacks and drive the stock higher overall by the close of the session.
Technical Analysis of Eli Lilly and Co (LLY)
Technically, Eli Lilly and Co (LLY) shows a MACD (12,26,9) value of -0.143, indicating a neutral signal. The RSI at 50.622 suggests neutral condition and the Williams %R at 43.482 suggests buy condition. Please monitor closely.
Media Coverage of Eli Lilly and Co (LLY)
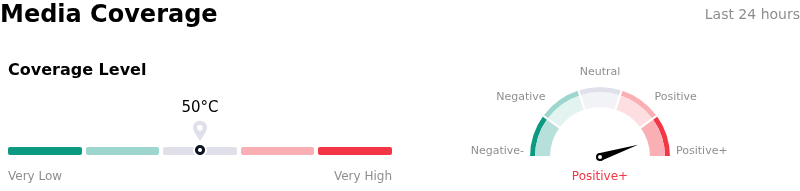
In terms of media coverage, Eli Lilly and Co (LLY) shows a coverage score of 50, indicating a moderate level of media attention. The overall market sentiment index is currently in extremely bullish zone.
Fundamental Analysis of Eli Lilly and Co (LLY)
Eli Lilly and Co (LLY) is in the Pharmaceuticals & Medical Research industry. Its latest annual revenue is $65.18B, ranking 4 in the industry. The net profit is $20.64B, ranking 2 in the industry. Company Profile
Over the past month, multiple analysts have rated the company as Buy, with an average price target of $1296.81, a high of $1600.00, and a low of $850.00.
More details about Eli Lilly and Co (LLY)
Company Specific Risks:
- U.S. Net Pricing Compression and Second-Half Rebate Headwinds: Realized product prices in the United States face ongoing downward pressure, representing a low-to-mid teens percentage drag on 2026 top-line growth, while the non-recurrence of favorable first-half rebate and discount adjustments creates immediate downside risk for second-half sales comparisons.
- Extreme Top-Line Concentration in Tirzepatide Portfolio: Mounjaro and Zepbound now account for roughly 65% of total corporate revenue, exposing the company's valuation to severe volatility if GLP-1 reimbursement policies tighten, adoption rates slow, or unexpected safety signals emerge.
- Intensifying Anti-Obesity Competition and Oral Rollout Risks: Accelerating market entries from rival therapeutics—including Novo Nordisk's oral Wegovy and competing pipeline candidates—threaten market share, placing intense commercial execution pressure on the rollout of Eli Lilly's oral GLP-1 drug, Foundayo.
- Demanding Valuation Multiple Amid Legacy Asset Contraction: With the stock trading at an elevated forward valuation multiple near a $1.1 trillion market cap, any operational misstep creates outsized pullbacks, particularly as legacy mature drugs like Trulicity, Taltz, and Verzenio face flat-to-declining sales trajectories.
This article may include AI-generated content that is human-reviewed, which is for reference and general information purposes only and does not constitute investment advice.
Recommended Articles










Comments (0)
Click the $ button, enter the symbol, and select to link a stock, ETF, or other ticker.