


Alibaba Group Holding Ltd Stock (BABA) Moved Up by 5.25% on Aug 3: Key Drivers Unveiled



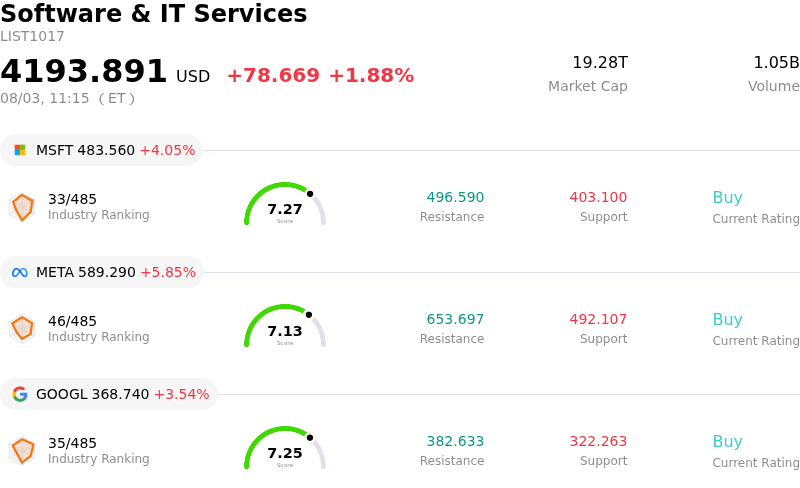
Alibaba Group Holding Ltd (BABA) moved up by 5.25%. The Software & IT Services sector is up by 1.88%. The company outperformed the industry. Top 3 stocks by turnover in the sector: Microsoft Corp (MSFT) up 4.05%; Meta Platforms Inc (META) up 5.73%; Alphabet Inc Class A (GOOGL) up 3.54%.
What is driving Alibaba Group Holding Ltd (BABA)’s stock price up today?
Alibaba is experiencing a notable surge in buying pressure as market sentiment toward Chinese technology firms shifts toward a more optimistic stance. This upward trajectory is primarily driven by a combination of favorable macroeconomic signals from Beijing and a better-than-expected recovery in domestic consumer spending. Investors are responding to recent government initiatives aimed at stabilizing the property market and stimulating retail activity, which directly benefits the company’s core e-commerce segments.
On the technology front, the cloud division continues to attract institutional interest following reports of accelerated adoption of proprietary large language models among enterprise clients. The integration of generative AI across marketplace platforms has begun to show improvements in merchant conversion rates and advertising yields. This fundamental progress is reassuring analysts who had previously expressed concerns regarding intensifying competition from discount-centric rivals.
Institutional positioning is also playing a significant role in the current movement. Large-scale capital flows into China-focused exchange-traded funds suggest a broader rebalancing by global fund managers who were previously underweight in the region. As risk appetite returns, the company remains a primary vehicle for gaining exposure to the Chinese digital economy due to its liquid share structure and significant cash reserves, which support its aggressive share buyback programs.
Despite the current momentum, market participants remain cautious regarding the evolving regulatory landscape and potential fluctuations in cross-border trade policies. However, the immediate focus remains on the ability to maintain market leadership while optimizing cost structures. The volatility observed today highlights a period of price discovery as the market reconciles long-term valuation discounts with improving operational efficiencies and a more supportive monetary environment.
Technical Analysis of Alibaba Group Holding Ltd (BABA)
Technically, Alibaba Group Holding Ltd (BABA) shows a MACD (12,26,9) value of 1.841, indicating a buy signal. The RSI at 64.211 suggests neutral condition and the Williams %R at 2.950 suggests overbought condition. Please monitor closely.
Fundamental Analysis of Alibaba Group Holding Ltd (BABA)
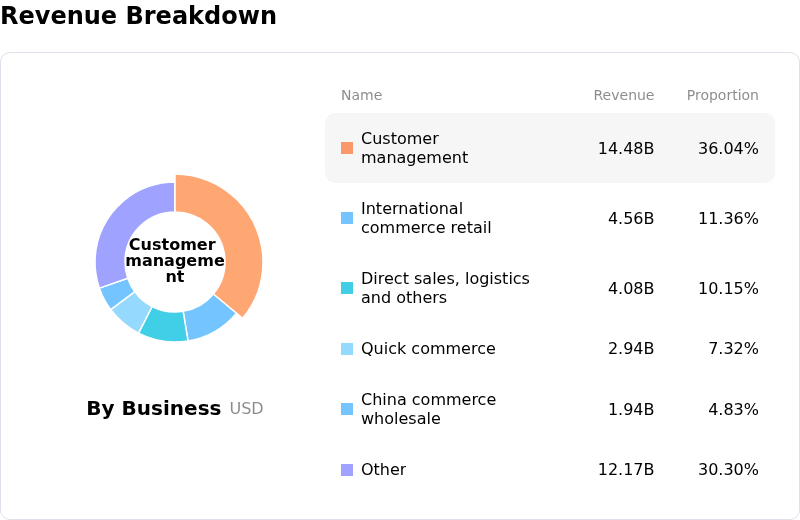
Alibaba Group Holding Ltd (BABA) is in the Software & IT Services industry. Its latest annual revenue is $144.14B, ranking 5 in the industry. The net profit is $14.91B, ranking 8 in the industry. Company Profile
Over the past month, multiple analysts have rated the company as Buy, with an average price target of $186.77, a high of $256.87, and a low of $92.00.
More details about Alibaba Group Holding Ltd (BABA)
Company Specific Risks:
- Regulatory Financial Penalty: EU regulators have imposed a EUR 550 million fine on the AliExpress subsidiary under the Digital Services Act (DSA), citing systemic failures to mitigate the distribution of illegal and counterfeit goods, which necessitates a costly and immediate corrective operational overhaul.
- Infrastructure Scalability Bottlenecks: Strategic partner Moonshot AI has been forced to halt new user subscriptions for its Kimi K3 model as demand has overwhelmed available computing capacity, highlighting significant scaling constraints within Alibaba’s cloud infrastructure support.
- Speculative Monetization Gap: Institutional analysts are cautioning that the launch of the Qwen3.8-Max AI model lacks "commercial evidence" for near-term revenue generation, leaving the stock vulnerable to a valuation correction if speculative AI hype fails to translate into tangible earnings growth.
- Persistent Margin Erosion: Aggressive capital deployment into AI infrastructure and "instant commerce" ventures has driven sales and marketing expenses to approximately 25.3% of total revenue, causing a sharp decline in free cash flow and creating sustained pressure on consolidated operating margins.
This article may include AI-generated content that is human-reviewed, which is for reference and general information purposes only and does not constitute investment advice.
Recommended Articles







Comments (0)
Click the $ button, enter the symbol, and select to link a stock, ETF, or other ticker.