


Ge Vernova Inc Stock (GEV) Moved Down by 4.13% on Jul 29: A Full Analysis



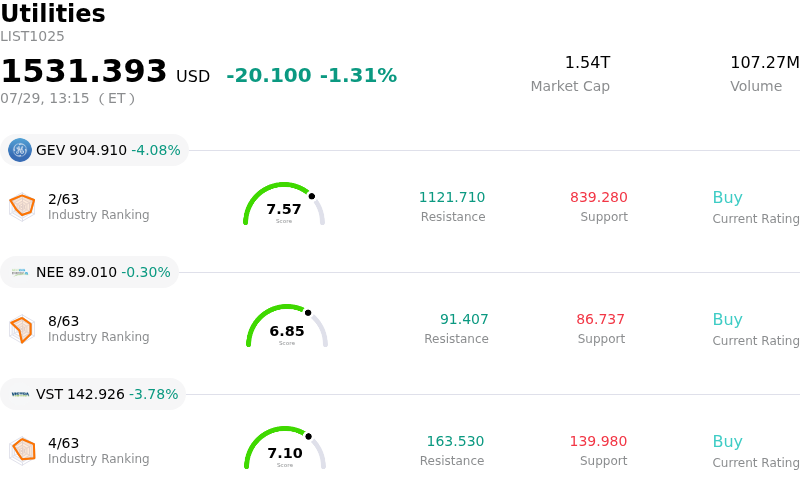
Ge Vernova Inc (GEV) moved down by 4.13%. The Utilities sector is down by 1.31%. The company underperformed the industry. Top 3 stocks by turnover in the sector: Ge Vernova Inc (GEV) down 3.99%; Nextera Energy Inc (NEE) down 0.30%; Vistra Corp (VST) down 3.78%.
What is driving Ge Vernova Inc (GEV)’s stock price down today?
GE Vernova experienced significant downward pressure during today's session, largely driven by a cautious reaction to the company's latest quarterly performance update and forward-looking guidance. While the firm continues to lead in the energy transition space, the market's focus has shifted toward the narrowing margins within its offshore wind division. Persistent logistical challenges and the rising costs of raw materials have signaled to investors that the path toward consistent profitability in the renewable segment may be longer and more volatile than previously anticipated.
The intraday volatility was further fueled by a broader sector rotation, as institutional portfolios adjusted for a high-interest-rate environment that remains a burden for large-scale infrastructure projects. Higher financing costs directly impact the demand for heavy power generation equipment and grid solutions, leading to a more conservative valuation of the company's long-term contract backlog. As investors recalibrate their risk appetite, the industrial sector has seen a general retreat, with high-growth entities like GE Vernova bearing the brunt of the liquidations.
Additionally, recent analyst notes have highlighted potential risks regarding the timing of government-funded green energy initiatives. Uncertainties surrounding the implementation of energy policy and the distribution of subsidies have introduced a layer of geopolitical and regulatory risk that was not fully priced in. This has prompted a series of price target adjustments from major brokerage firms, leading to an increase in selling volume as the stock broke through several technical support levels.
Market sentiment also appears to be influenced by external macroeconomic factors, including the latest inflation data which suggests that central bank easing may be further off than the market had hoped. For a company heavily reliant on capital expenditure from utilities and government entities, any delay in rate cuts represents a direct threat to project pipelines. Consequently, the combination of specific operational hurdles and a challenging macro backdrop has resulted in the current price correction and heightened market sensitivity.
Technical Analysis of Ge Vernova Inc (GEV)
Technically, Ge Vernova Inc (GEV) shows a MACD (12,26,9) value of -29.279, indicating a neutral signal. The RSI at 38.710 suggests neutral condition and the Williams %R at 86.869 suggests oversold condition. Please monitor closely.
Media Coverage of Ge Vernova Inc (GEV)
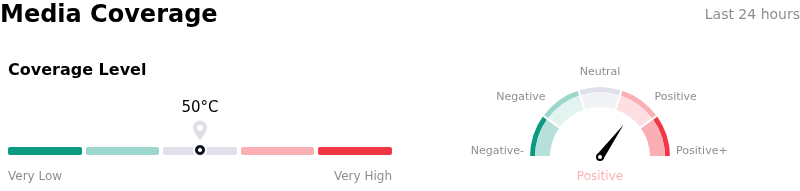
In terms of media coverage, Ge Vernova Inc (GEV) shows a coverage score of 50, indicating a moderate level of media attention. The overall market sentiment index is currently in bullish zone.
Fundamental Analysis of Ge Vernova Inc (GEV)
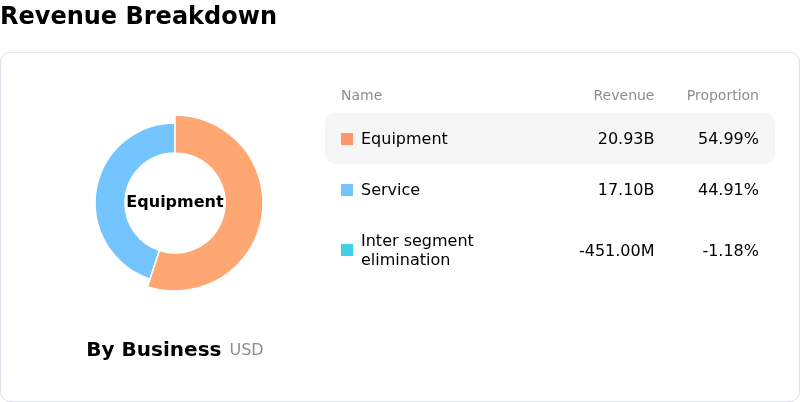
Ge Vernova Inc (GEV) is in the Utilities industry. Its latest annual revenue is $38.07B, ranking 2 in the industry. The net profit is $4.88B, ranking 4 in the industry. Company Profile
Over the past month, multiple analysts have rated the company as Buy, with an average price target of $1224.87, a high of $1450.00, and a low of $836.00.
More details about Ge Vernova Inc (GEV)
Company Specific Risks:
- Earnings Underperformance and Wind Segment Drag: The company reported a significant Q2 earnings miss with adjusted EPS of $2.47 against the $3.04 analyst consensus, primarily due to persistent operational losses in the Wind division that are now forecasted to reach $400 million for the fiscal year.
- Contingent Liabilities and Litigation: GE Vernova faces escalating legal exposure and indemnity claims exceeding $800 million related to the 2024 Vineyard Wind blade failure, as recent court proceedings highlight unresolved manufacturing defects and quality assurance failures in the Haliade-X fleet.
- Tariff-Driven Margin Compression: Management's recent financial disclosures indicate that newly implemented global trade tariffs will impose between $100 million and $200 million in unexpected costs for the remainder of 2026, directly threatening margin expansion targets within the Electrification and Power segments.
- Backlog Execution and Quality Control Risks: Despite a record $176 billion backlog, institutional concerns have intensified regarding the company's ability to scale manufacturing capacity without further "manufacturing deviations," particularly as insider selling signals potential skepticism over near-term free cash flow conversion.
This article may include AI-generated content that is human-reviewed, which is for reference and general information purposes only and does not constitute investment advice.
Recommended Articles








Comments (0)
Click the $ button, enter the symbol, and select to link a stock, ETF, or other ticker.