


Bitcoin (BTCUSD) Fluctuated Significantly on Jul 6: Key Variables Behind the Move



Bitcoin (BTCUSD) is up 1.02% at Jul 6 00:05(ET), now at $63340.02, with a 7-day up of 5.10%.
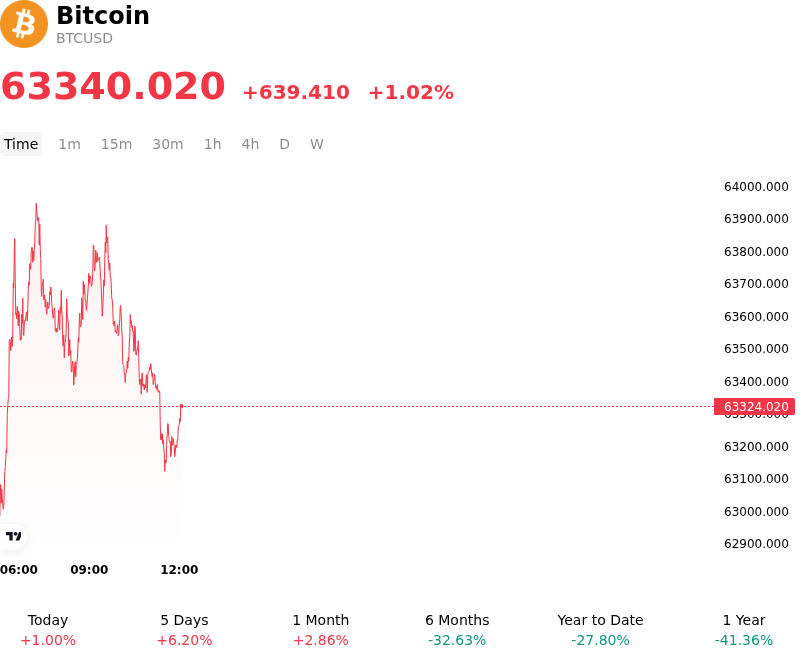
What is driving Bitcoin (BTCUSD)’s stock price up today?
The primary driver of the positive shift in Bitcoin price action was a substantial repricing of global monetary policy expectations following highly disappointing U.S. labor market data. The June Nonfarm Payrolls report revealed the addition of only 57,000 jobs, falling dramatically short of consensus forecasts. This weaker-than-expected economic indicator significantly reduced the probability of near-term Federal Reserve interest rate hikes. The subsequent decline in U.S. Treasury yields and a softening dollar effectively lowered the opportunity cost of holding non-yielding digital assets, injecting renewed liquidity and risk appetite back into the crypto ecosystem.
This shift in macroeconomic sentiment occurred alongside a notable stabilization in institutional demand. U.S. spot Bitcoin exchange-traded funds snapped a painful ten-day outflow streak, posting net inflows exceeding $220 million. This reversal of capital flight, led by inflows into major spot funds, indicated that institutional buyers were stepping back in to defend key psychological support levels. Furthermore, long-term accumulation trends continued to bolster market structure, with corporate treasuries quietly absorbing circulating supply and providing a structural floor under prices.
Speculative derivatives positioning heavily amplified the upward momentum, leading to a classic short squeeze. In the preceding weeks, defensive options positioning and growing bearish conviction had left the derivatives market highly exposed to a sharp reversal. As Bitcoin broke past critical technical levels near the $62,000 threshold, short-sellers were caught off guard, triggering massive forced liquidations across major exchanges. These cascading buybacks exacerbated the upward momentum and accelerated the asset's recovery.
On-chain metrics and regulatory developments further supported the market's attempt at stabilization. Over the medium term, transaction volume on the Bitcoin network has remained historically elevated, reflecting robust and routine utilization. Concurrently, progress on the legislative front with the CLARITY Act helped bolster long-term compliance and institutional adoption expectations.
Despite this technical and liquidity-driven recovery, professional investors remain highly cautious. The broader sentiment backdrop still carries lingering pessimism, as evidenced by a heavily depressed Fear and Greed Index and the structural damage from the preceding month's record ETF outflows. For the current rally to establish a durable structural trend, market participants are watching for sustained spot ETF inflows and further macro confirmation that financial conditions will continue to ease.
Technical Analysis of Bitcoin (BTCUSD)
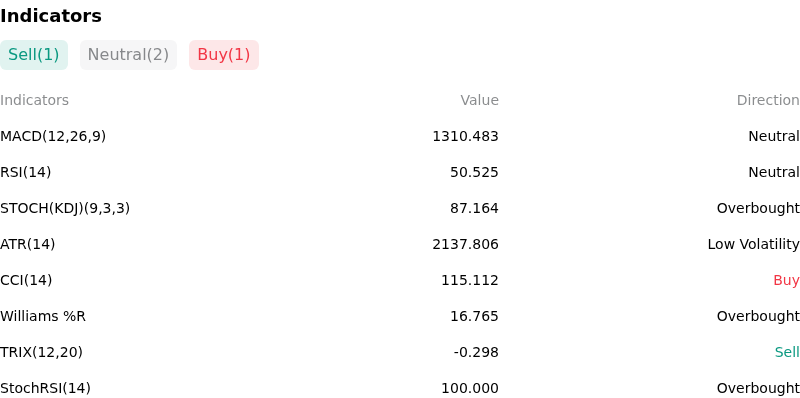
Technically, Bitcoin (BTCUSD) shows a MACD (12,26,9) value of 1310.483, indicating a neutral signal. The RSI at 50.525 suggests neutral condition and the Williams %R at 16.765 suggests overbought condition. Please monitor closely.
More details about Bitcoin (BTCUSD)
Recent Events and Risks:
- Institutional Capital Flight and Citigroup Target Downgrades: Despite a temporary short-squeeze relief rally above $63,000, Bitcoin’s long-term institutional demand remains severely compromised. In July 2026, Citigroup downgraded its 12-month Bitcoin price target from $112,000 to $82,000 and lowered its net-ETF inflow forecast to zero, citing a structural breakdown in spot demand after ETFs suffered a record $4.5 billion in net outflows in June.
- Artificial Intelligence (AI) Capital Diversion: Capital is actively rotating away from digital assets and toward high-performing AI-related equities. The sustained drain of liquidity into non-crypto tech sectors has starved the spot crypto market of the depth required to stage a durable trend reversal, leaving Bitcoin highly vulnerable to quick downside reversals.
- MiCA Compliance Shock and Exchange Disruption: Regulatory enforcement in Europe has intensified following the July 1, 2026, Markets in Crypto-Assets (MiCA) deadline. This regulatory shift has driven major global exchanges, such as Binance, to halt spot trading, deposits, and Earn products for EU residents due to lack of local authorization, introducing localized selling pressure and reducing overall market liquidity.
- Bearish Head and Shoulders Chart Structure: On the three-day timeframe, technical analysts warn of a prominent head and shoulders pattern. If Bitcoin fails to defend the psychological and structural support levels around $58,000–$60,000, a breakdown below the key Fibonacci support level at $55,298 could trigger a major technical liquidation cascade toward the $50,000–$53,000 zone.
This article may include AI-generated content that is human-reviewed, which is for reference and general information purposes only and does not constitute investment advice.
Recommended Articles









Comments (1)
Click the $ button, enter the symbol, and select to link a stock, ETF, or other ticker.