

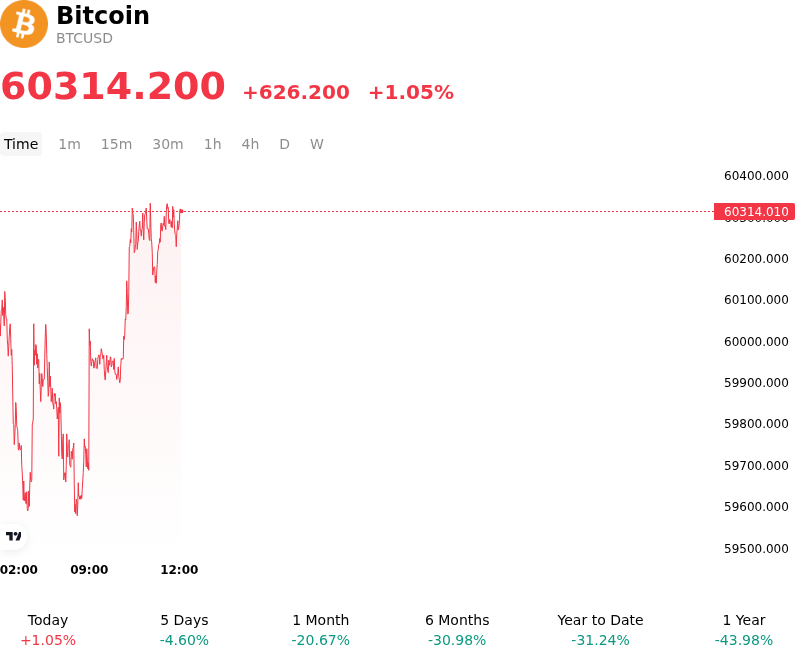
Bitcoin (BTCUSD) Is up 1.05% on Jun 27: What Are the Risk Factors?

Bitcoin (BTCUSD) is up 1.05% at Jun 27 00:05(ET), now at $60314.2, with a 7-day down of 5.61%.
What is driving Bitcoin (BTCUSD)’s stock price up today?
Bitcoin experienced notable intraday volatility and managed a modest advance as the market absorbed a series of heavy structural headwinds and engaged in a technical rebound from oversold conditions. The primary catalyst for the stabilizing price action was the passing of a massive June derivatives expiration on Deribit, where approximately $10.5 billion in options contracts expired. This major monthly reset cleared a substantial overhang of open interest, particularly around the highly contested $60,000 strike level, paving the way for spot-driven buying to reclaim some lost ground after a multi-day slide.
The bounce was also heavily supported by a dramatic reduction in liquidation volumes, which fell significantly in the preceding 24 hours. This sharp decline in forced sell-side pressure indicated that the cascade of leveraged liquidations that had driven the cryptocurrency below the critical $60,000 threshold had temporarily run its course. With the immediate liquidations exhausted, short sellers began covering their positions, while spot buyers stepped in to defend key technical support levels, viewing the sub-$60,000 region as an attractive accumulation zone.
Furthermore, a minor stabilization in broader global macro risk sentiment helped arrest the downward momentum. In previous sessions, digital assets had traded in close tandem with highly valued semiconductor and artificial intelligence equities, suffering alongside them as macro funds treated both sectors as a singular long-duration risk basket. As global equity markets began to find their footing and the initial shock of the tech sector's retreat subsided, the intense correlation weakened, allowing capital to flow back into major digital assets.
Underlying institutional dynamics also showed signs of near-term stabilization. Although the market had been battered by persistent spot Bitcoin exchange-traded fund outflows throughout June, the pace of the bleed began to moderate, reducing the daily supply overhang. At the same time, the broader stablecoin ecosystem saw robust demand and continued to inject critical liquidity into the market, providing the essential cash backstop needed to stabilize trading pairs.
Investors continue to monitor structural risks, including a hawkish pause from the Federal Reserve that has kept borrowing costs restrictive, alongside political uncertainty surrounding the legislative timeline of the bipartisan Clarity Act in the United States. However, the combination of derivatives market deleveraging, stabilizing equity markets, and technical oversold dynamics successfully neutralized the prevailing bearish sentiment, enabling a relief rally.
Technical Analysis of Bitcoin (BTCUSD)
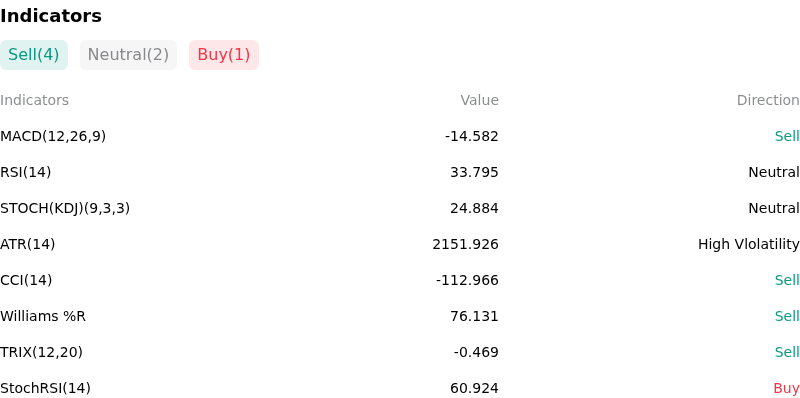
Technically, Bitcoin (BTCUSD) shows a MACD (12,26,9) value of -14.582, indicating a sell signal. The RSI at 33.795 suggests neutral condition and the Williams %R at 76.131 suggests sell condition. Please monitor closely.
More details about Bitcoin (BTCUSD)
Recent Events and Risks:
- Hawkish Macro Outlook and Core PCE Inflation Shock: On June 25, 2026, the U.S. Core Personal Consumption Expenditures (PCE) inflation index printed at a three-year high of 4.1%. This hotter-than-expected data has reignited hawkish Federal Reserve sentiment and pushed expectations for interest rate cuts into late 2026 or 2027, driving a broad risk-off rotation that dragged BTC below the key $60,000 support level.
- Accelerating Spot ETF Outflows and Thinning Liquidity: On June 25, 2026, U.S. spot Bitcoin ETFs experienced their heaviest single-day withdrawal of the month, losing $696.3 million (led by BlackRock’s IBIT and Fidelity’s FBTC), pushing total June outflows to $3.61 billion. Order-book data indicates that market makers have aggressively thinned out their bids on the demand side, leaving BTC highly vulnerable to rapid, asymmetric downside moves on low volume.
- Leverage Unwind and Intense Liquidation Cascade: The break below $60,000 triggered a severe long squeeze and a flash crash to a multi-month low of $58,115 on June 25, wiping out $48 billion in market capitalization in just 25 minutes. This rapid downward momentum initiated a massive leverage flush, resulting in over $665 million in liquidations within 24 hours, of which more than $543 million were forced long BTC closures.
- Corporate Contagion Fears and Regulatory Headwinds: Market anxiety has surged over Strategy Inc. (formerly MicroStrategy) as its preferred stock (STRC) plunged to record lows of $75, raising concerns that the firm may face a "death spiral" forcing it to liquidate some of its massive BTC treasury to fund its dividend shortfalls. This panic is compounded by looming political gridlock that is expected to delay the passage of the highly anticipated bipartisan crypto market structure bill (the Clarity Act) past its July 4 deadline.
This article may include AI-generated content that is human-reviewed, which is for reference and general information purposes only and does not constitute investment advice.
Recommended Articles


Comments (0)
Click the $ button, enter the symbol, and select to link a stock, ETF, or other ticker.