

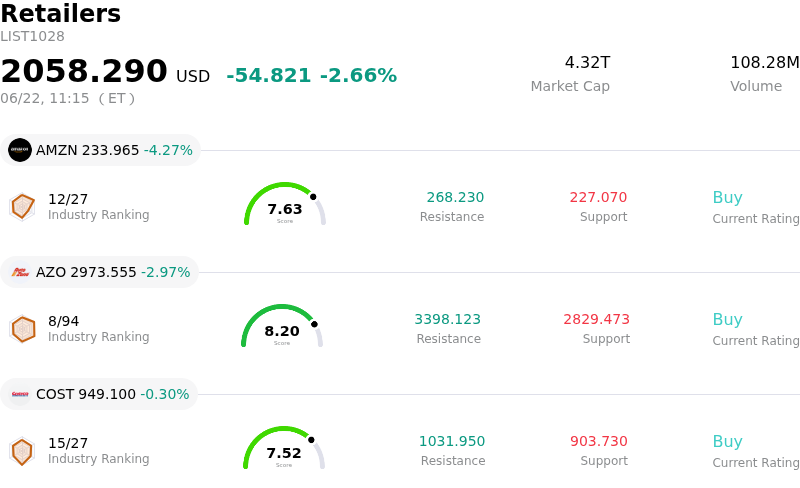
Amazon.com Inc Stock (AMZN) Moved Down by 4.27% on Jun 22: Key Drivers Unveiled

Amazon.com Inc (AMZN) moved down by 4.27%. The Retailers sector is down by 2.66%. The company underperformed the industry. Top 3 stocks by turnover in the sector: Amazon.com Inc (AMZN) down 4.27%; Autozone Inc (AZO) down 2.88%; Costco Wholesale Corp (COST) down 0.30%.
What is driving Amazon.com Inc (AMZN)’s stock price down today?
The recent downward pressure and heightened intraday volatility in Amazon's stock are primarily driven by a convergence of macroeconomic headwinds, intense debates over massive artificial intelligence capital expenditures, and shifting technical sentiment.
On the macroeconomic front, the hawkish stance of the Federal Reserve under its new leadership has weighed heavily on mega-cap growth stocks. The central bank's decision to hold interest rates steady, combined with projections of potential rate hikes later this year to combat persistent inflation, has dampened investor appetite for high-valuation tech giants. For capital-intensive companies like Amazon, a prolonged high-interest-rate environment increases borrowing costs and raises the hurdle rate for long-term investments.
Furthermore, investors are intensely debating Amazon's capital allocation strategy. The company has committed to an unprecedented annual capital expenditure budget of approximately two hundred billion dollars for 2026, aimed at scaling its artificial intelligence data centers, AWS infrastructure, and custom silicon like Trainium AI chips. While these investments position AWS to capitalize on the generational shift toward enterprise AI adoption, they have severely compressed near-term free cash flow. Wall Street is grappling with this cash flow pressure, questioning the timeline for meaningful return on investment and whether peak margins can be sustained amidst rising hardware and memory costs.
From a technical perspective, the stock has recently slipped below its critical short- and medium-term moving averages, including its twenty-day and fifty-day exponential moving averages. This technical breach has triggered programmatic selling and institutional distribution, amplifying the stock's downward momentum. Although long-term technical support around the two-hundred-day moving average remains intact, the near-term chart structure is tilted bearish, leaving the stock highly sensitive to market swings.
Finally, the upcoming four-day Prime Day event, which was shifted earlier to late June, is acting as a major litmus test for consumer discretionary spending. Amid stubborn inflation and rising fuel costs, analysts expect a consumer shift toward lower-margin essentials like groceries and household basics rather than high-margin discretionary goods. Additionally, synchronized promotional events from rivals like Walmart and Target are intensifying price competition, adding to the near-term margin worries that are keeping investors cautious.
Technical Analysis of Amazon.com Inc (AMZN)
Technically, Amazon.com Inc (AMZN) shows a MACD (12,26,9) value of -2.830, indicating a sell signal. The RSI at 44.029 suggests neutral condition and the Williams %R at 67.312 suggests sell condition. Please monitor closely.
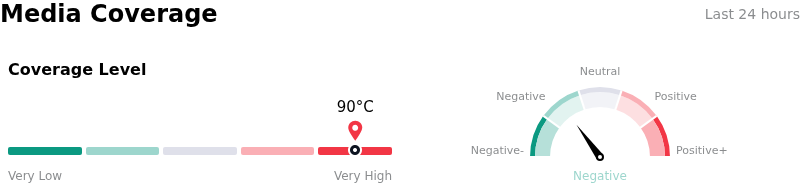
Media Coverage of Amazon.com Inc (AMZN)
In terms of media coverage, Amazon.com Inc (AMZN) shows a coverage score of 90, indicating a very high level of media attention. The overall market sentiment index is currently in bearish zone.
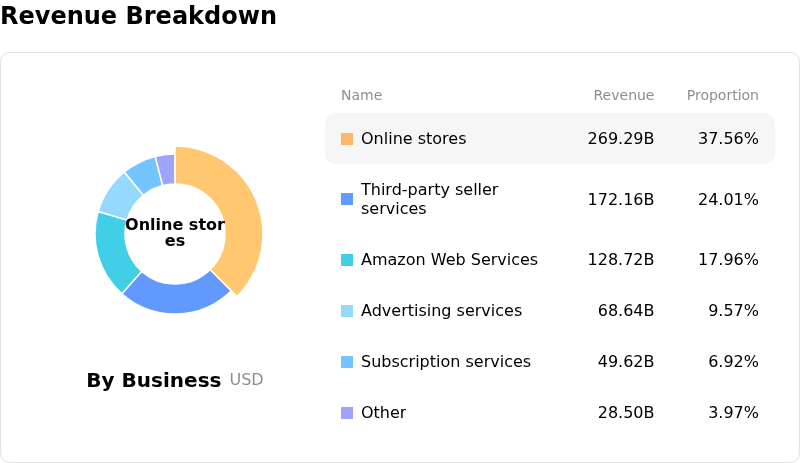
Fundamental Analysis of Amazon.com Inc (AMZN)
Amazon.com Inc (AMZN) is in the Retailers industry. Its latest annual revenue is $716.92B, ranking 1 in the industry. The net profit is $77.67B, ranking 1 in the industry. Company Profile
Over the past month, multiple analysts have rated the company as Buy, with an average price target of $309.24, a high of $370.00, and a low of $207.00.
More details about Amazon.com Inc (AMZN)
Company Specific Risks:
- Imminent FTC Advertising Practices Lawsuit: Reports emerging on June 16–17, 2026, indicate that the U.S. Federal Trade Commission (FTC) and multiple state attorneys general are drafting a formal antitrust complaint targeting Amazon's $70 billion advertising business. The investigation focuses on allegations that the company misled advertisers and obscured pricing structures, including "reserve pricing" thresholds, creating risks of billions of dollars in civil penalties and severe disruptions to its highest-margin business segment.
- Regulatory Scrutiny under EU Digital Markets Act (DMA): On June 18, 2026, reports surfaced that the European Commission plans to release preliminary findings designating Amazon Web Services (AWS) as a "gatekeeper" under the DMA. A final designation would subject AWS to costly operational adjustments, interoperability requirements, and bans on customer lock-in practices, with potential non-compliance penalties reaching up to 10% of global annual turnover.
- High Capex Requirements and Near-Term Cash Flow Pressure: Massive infrastructure commitments—such as a newly announced €10 billion next-generation robotics and fulfillment center expansion in Europe—along with aggressive global AI data center build-outs, are creating significant near-term capital expenditure overhangs. Institutional analysts remain concerned that these heavy investments will squeeze operating margins and drag on free cash flow throughout 2026.
- Sustained Insider Divestment and Sector Capital Rotation: Regulatory and transactional filings compiled in mid-June 2026 highlight that Amazon corporate insiders have liquidated approximately $51.6 million in shares over the past three months with zero corresponding insider purchases. This ongoing insider exit, compounded by a broader passive index and active fund liquidity rotation out of legacy mega-cap tech, continues to pressure equity valuations.
This article may include AI-generated content that is human-reviewed, which is for reference and general information purposes only and does not constitute investment advice.
Recommended Articles


Comments (0)
Click the $ button, enter the symbol, and select to link a stock, ETF, or other ticker.