


USD/CHF Price Forecast: Rejected at 100-day SMA, eyes on 0.7800



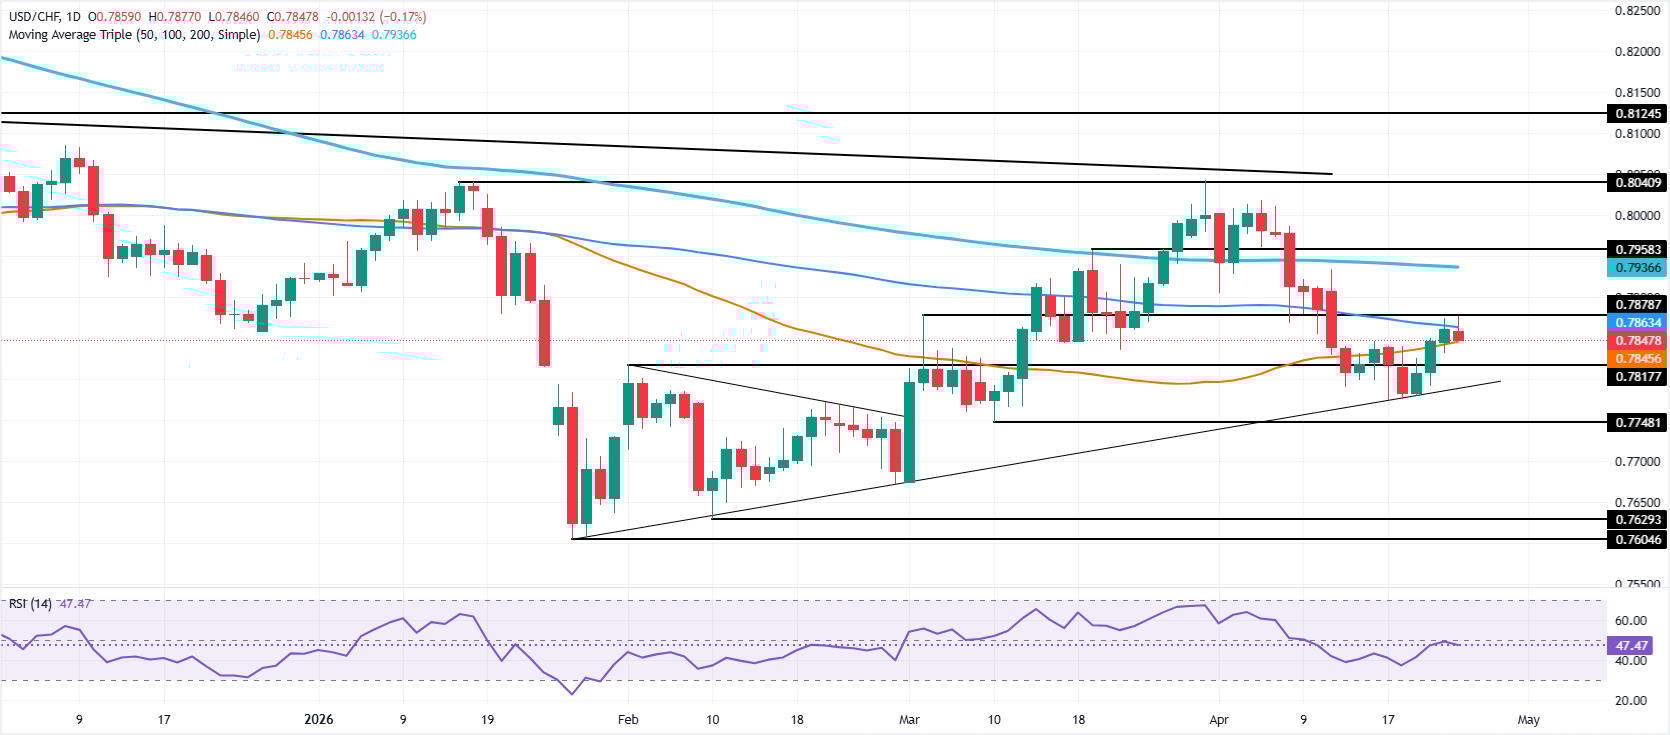
- USD/CHF fails at 100-day SMA, signaling resistance remains intact.
- RSI turns lower, confirming growing bearish momentum pressure.
- Break below 0.7800 exposes 0.7775 and 0.7748 support levels.
USD/CHF dropped on Friday, yet it finished the week with gains of over 0.35%, trading at 0.7841, down 0.28%, as market participants grew confident that US-Iran talks could resume over the weekend to resolve the conflict.
USD/CHF Price Forecast: Technical Outlook
From a technical perspective, USD/CHF appears poised to remain in a consolidation within the 0.7800-0.7900 range. Momentum, as measured by the Relative Strength Index (RSI), suggests further downside, as the index is bearish and pointing lower.
Price action suggests the uptrend might be pausing after hitting a nine-day high of 0.7877, but closing near the 50-day SMA at 0.7840 and failing to clear key resistance at the 100-day SMA at 0.7863 open the door to further downside.
If market mood remains optimistic, the USD/CHF could test lower levels, with the first area of interest at 0.7800. On further weakness, April 17 low of 0.7775 ─the last cycle low─, would be the next key support ahead of clearing the path towards the March 10 daily log of 0.7748, ahead of February’s 27 daily low of 0.7672.
On the other hand, if buyers reclaim the 100-day SMA, the next line of resistance would be the 0.7900 mark. A breach of the latter will expose the 200-day SMA at 0.7936 ahead of 0.8000.
USD/CHF Price Chart – Daily
Swiss Franc Price This week
The table below shows the percentage change of Swiss Franc (CHF) against listed major currencies this week. Swiss Franc was the strongest against the Japanese Yen.
| USD | EUR | GBP | JPY | CAD | AUD | NZD | CHF | |
|---|---|---|---|---|---|---|---|---|
| USD | 0.15% | -0.35% | 0.35% | -0.14% | -0.38% | -0.34% | 0.43% | |
| EUR | -0.15% | -0.51% | 0.00% | -0.27% | -0.52% | -0.56% | 0.28% | |
| GBP | 0.35% | 0.51% | 2.17% | 0.26% | 0.02% | -0.02% | 0.79% | |
| JPY | -0.35% | 0.00% | -2.17% | -0.51% | -0.67% | -0.71% | 0.04% | |
| CAD | 0.14% | 0.27% | -0.26% | 0.51% | -0.13% | -0.21% | 0.55% | |
| AUD | 0.38% | 0.52% | -0.02% | 0.67% | 0.13% | 0.02% | 0.79% | |
| NZD | 0.34% | 0.56% | 0.02% | 0.71% | 0.21% | -0.02% | 0.77% | |
| CHF | -0.43% | -0.28% | -0.79% | -0.04% | -0.55% | -0.79% | -0.77% |
The heat map shows percentage changes of major currencies against each other. The base currency is picked from the left column, while the quote currency is picked from the top row. For example, if you pick the Swiss Franc from the left column and move along the horizontal line to the US Dollar, the percentage change displayed in the box will represent CHF (base)/USD (quote).
Recommended Articles








Comments (0)
Click the $ button, enter the symbol, and select to link a stock, ETF, or other ticker.