


GBP/JPY Price Analysis: Moves above 206.00 ahead of UK Autumn Budget



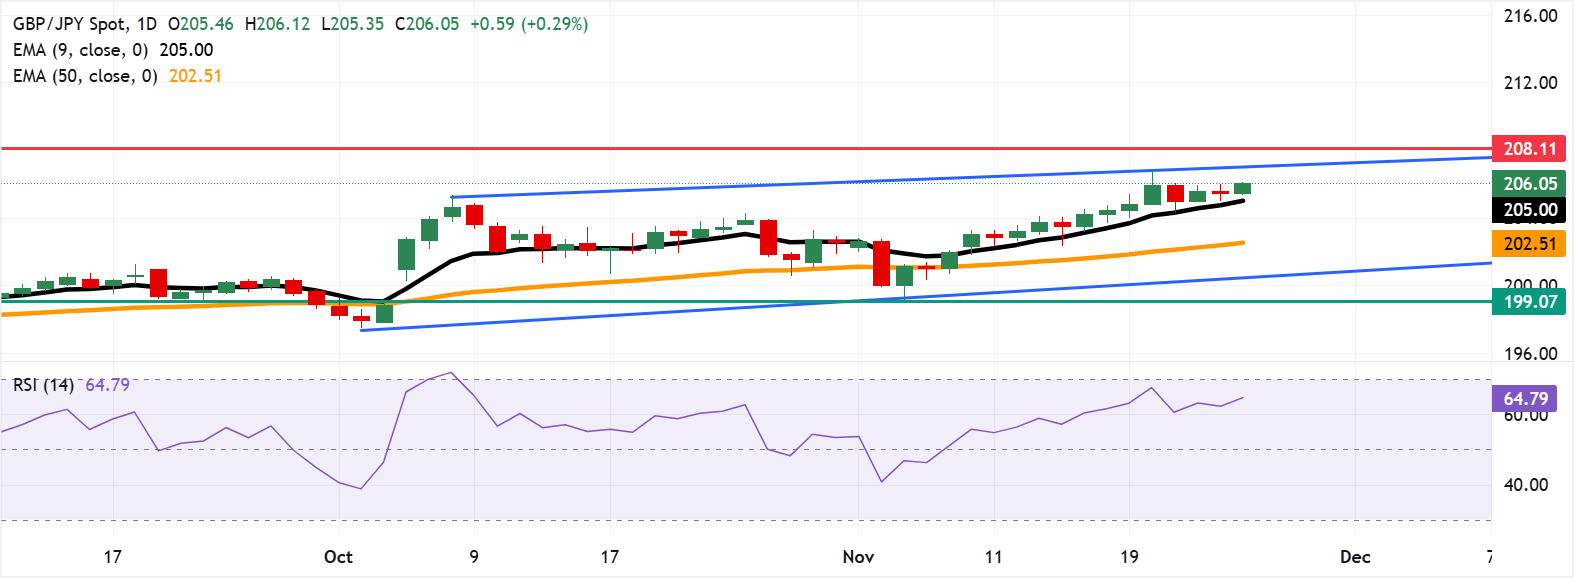
- GBP/JPY may target the crucial level of 207.00, near the upper ascending channel boundary.
- The 14-day Relative Strength Index has risen from 62.31 to 64.60, reinforcing the bullish momentum.
- The primary support lies at the nine-day EMA of 205.00.
GBP/JPY gains nearly 0.25% after registering modest losses in the previous session, trading around 206.00 during the early European hours on Wednesday. Traders await the United Kingdom (UK) Chancellor of the Exchequer, Rachel Reeves, to deliver the Autumn Budget later in the day.
A look at the daily chart shows the currency cross is moving upwards within an ascending channel pattern, indicating a persistent bullish bias. Additionally, the 14-day Relative Strength Index (RSI), a key momentum gauge, has improved from 62.31 to 64.79, reinforcing positive momentum.
The GBP/JPY cross extends its advance above the rising nine- and 50-day Exponential Moving Averages (EMAs) at 205.00 and 202.51, respectively, keeping a bullish bias intact as the short-term average holds above the medium-term one.
The GBP/JPY cross may find its primary resistance at the psychological level of 207.00, followed by the ascending channel’s upper boundary at 207.10. A break above this level would support the currency cross to test the all-time high of 208.11, which was recorded in July 2024.
On the downside, the GBP/JPY cross may find its primary support at the nine-day EMA of 205.00. A break below the short-term moving average would prompt the currency cross to test the 50-day EMA of 202.51. Further support lies at the lower boundary of the ascending channel around 200.50, followed by an eight-week low of 199.07.
(The technical analysis of this story was written with the help of an AI tool.)
Pound Sterling Price Today
The table below shows the percentage change of British Pound (GBP) against listed major currencies today. British Pound was the strongest against the Japanese Yen.
| USD | EUR | GBP | JPY | CAD | AUD | NZD | CHF | |
|---|---|---|---|---|---|---|---|---|
| USD | -0.10% | -0.05% | 0.19% | -0.21% | -0.46% | -1.02% | -0.21% | |
| EUR | 0.10% | 0.06% | 0.29% | -0.09% | -0.36% | -0.90% | -0.12% | |
| GBP | 0.05% | -0.06% | 0.25% | -0.16% | -0.42% | -0.95% | -0.17% | |
| JPY | -0.19% | -0.29% | -0.25% | -0.40% | -0.65% | -1.18% | -0.40% | |
| CAD | 0.21% | 0.09% | 0.16% | 0.40% | -0.27% | -0.80% | -0.01% | |
| AUD | 0.46% | 0.36% | 0.42% | 0.65% | 0.27% | -0.54% | 0.25% | |
| NZD | 1.02% | 0.90% | 0.95% | 1.18% | 0.80% | 0.54% | 0.79% | |
| CHF | 0.21% | 0.12% | 0.17% | 0.40% | 0.00% | -0.25% | -0.79% |
The heat map shows percentage changes of major currencies against each other. The base currency is picked from the left column, while the quote currency is picked from the top row. For example, if you pick the British Pound from the left column and move along the horizontal line to the US Dollar, the percentage change displayed in the box will represent GBP (base)/USD (quote).
Recommended Articles








Comments (0)
Click the $ button, enter the symbol, and select to link a stock, ETF, or other ticker.