

EUR/JPY Price Forecast: Holds losses near 176.00 near nine-day EMA support

- EUR/JPY may target the initial barrier at the all-time high of 177.94.
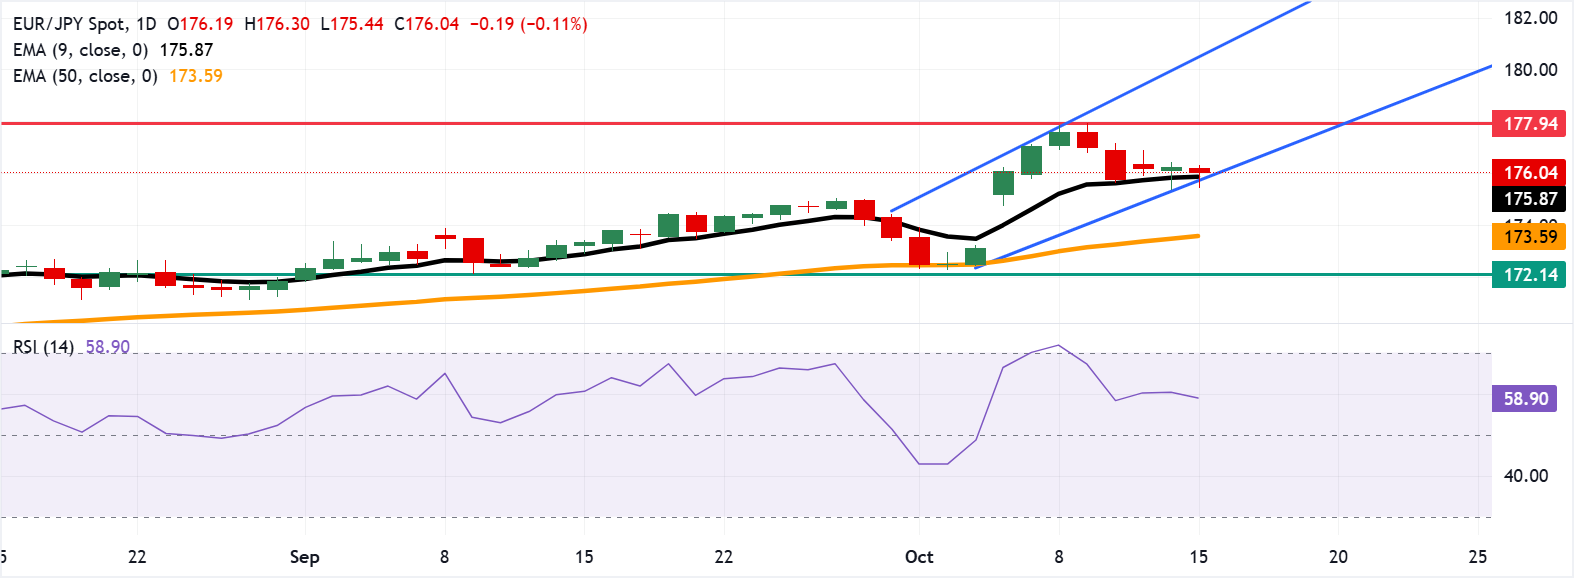
- The 14-day Relative Strength Index remains above the 50 level, strengthening the bullish bias.
- The primary support lies at the nine-day EMA of 175.87.
EUR/JPY depreciates after registering little gains in the previous session, hovering around 176.00 during the European trading hours on Wednesday. The technical analysis of the daily chart indicates a bullish revival as the currency cross remains within the ascending channel pattern.
Additionally, the short-term price momentum is stronger as the EUR/JPY cross has rebounded above the nine-day Exponential Moving Average (EMA). The 14-day Relative Strength Index (RSI) is positioned above the 50 mark, suggesting that bullish bias is strengthening.
On the upside, the EUR/JPY cross may explore the region around the record high of 177.94, which was recorded on October 9. A break above this level would support the bullish bias and lead the currency cross to test the upper boundary of the ascending channel around 180.60.
The EUR/JPY cross is testing its immediate support at the nine-day EMA of 175.87, aligned with the ascending channel’s lower boundary around 175.80. A break below this confluence support zone would weaken the bullish bias and put downward pressure on the currency cross to navigate the area around the 50-day EMA at 173.59, followed by the six-week low of 172.14, which was recorded on September 9.
EUR/JPY: Daily Chart
Euro Price Today
The table below shows the percentage change of Euro (EUR) against listed major currencies today. Euro was the weakest against the Australian Dollar.
| USD | EUR | GBP | JPY | CAD | AUD | NZD | CHF | |
|---|---|---|---|---|---|---|---|---|
| USD | -0.24% | -0.23% | -0.30% | 0.00% | -0.50% | 0.01% | -0.19% | |
| EUR | 0.24% | 0.05% | -0.05% | 0.23% | -0.22% | 0.20% | 0.06% | |
| GBP | 0.23% | -0.05% | -0.10% | 0.21% | -0.27% | 0.14% | 0.06% | |
| JPY | 0.30% | 0.05% | 0.10% | 0.25% | -0.23% | 0.12% | 0.18% | |
| CAD | -0.00% | -0.23% | -0.21% | -0.25% | -0.51% | -0.06% | -0.15% | |
| AUD | 0.50% | 0.22% | 0.27% | 0.23% | 0.51% | 0.42% | 0.34% | |
| NZD | -0.01% | -0.20% | -0.14% | -0.12% | 0.06% | -0.42% | -0.08% | |
| CHF | 0.19% | -0.06% | -0.06% | -0.18% | 0.15% | -0.34% | 0.08% |
The heat map shows percentage changes of major currencies against each other. The base currency is picked from the left column, while the quote currency is picked from the top row. For example, if you pick the Euro from the left column and move along the horizontal line to the US Dollar, the percentage change displayed in the box will represent EUR (base)/USD (quote).
Recommended Articles


Comments (0)
Click the $ button, enter the symbol, and select to link a stock, ETF, or other ticker.