


GBP/CAD Price Prediction: Rising Wedge pattern could be vulnerable to break down

FXStreetNov 8, 2024 2:31 PM


View all comments(0)
- GBP/CAD might be completing a bearish Rising Wedge price pattern.
- If so, there is an increased risk of a downside break.
GBP/CAD recovers to trade back inside its Rising Wedge pattern after temporarily falling below the lower boundary line. It remains vulnerable to a downside break.
Rising Wedges are bearish patterns. Although there is no way of confirming GBP/CAD has formed one for sure it looks likely that it has.
GBP/CAD 4-hour Chart
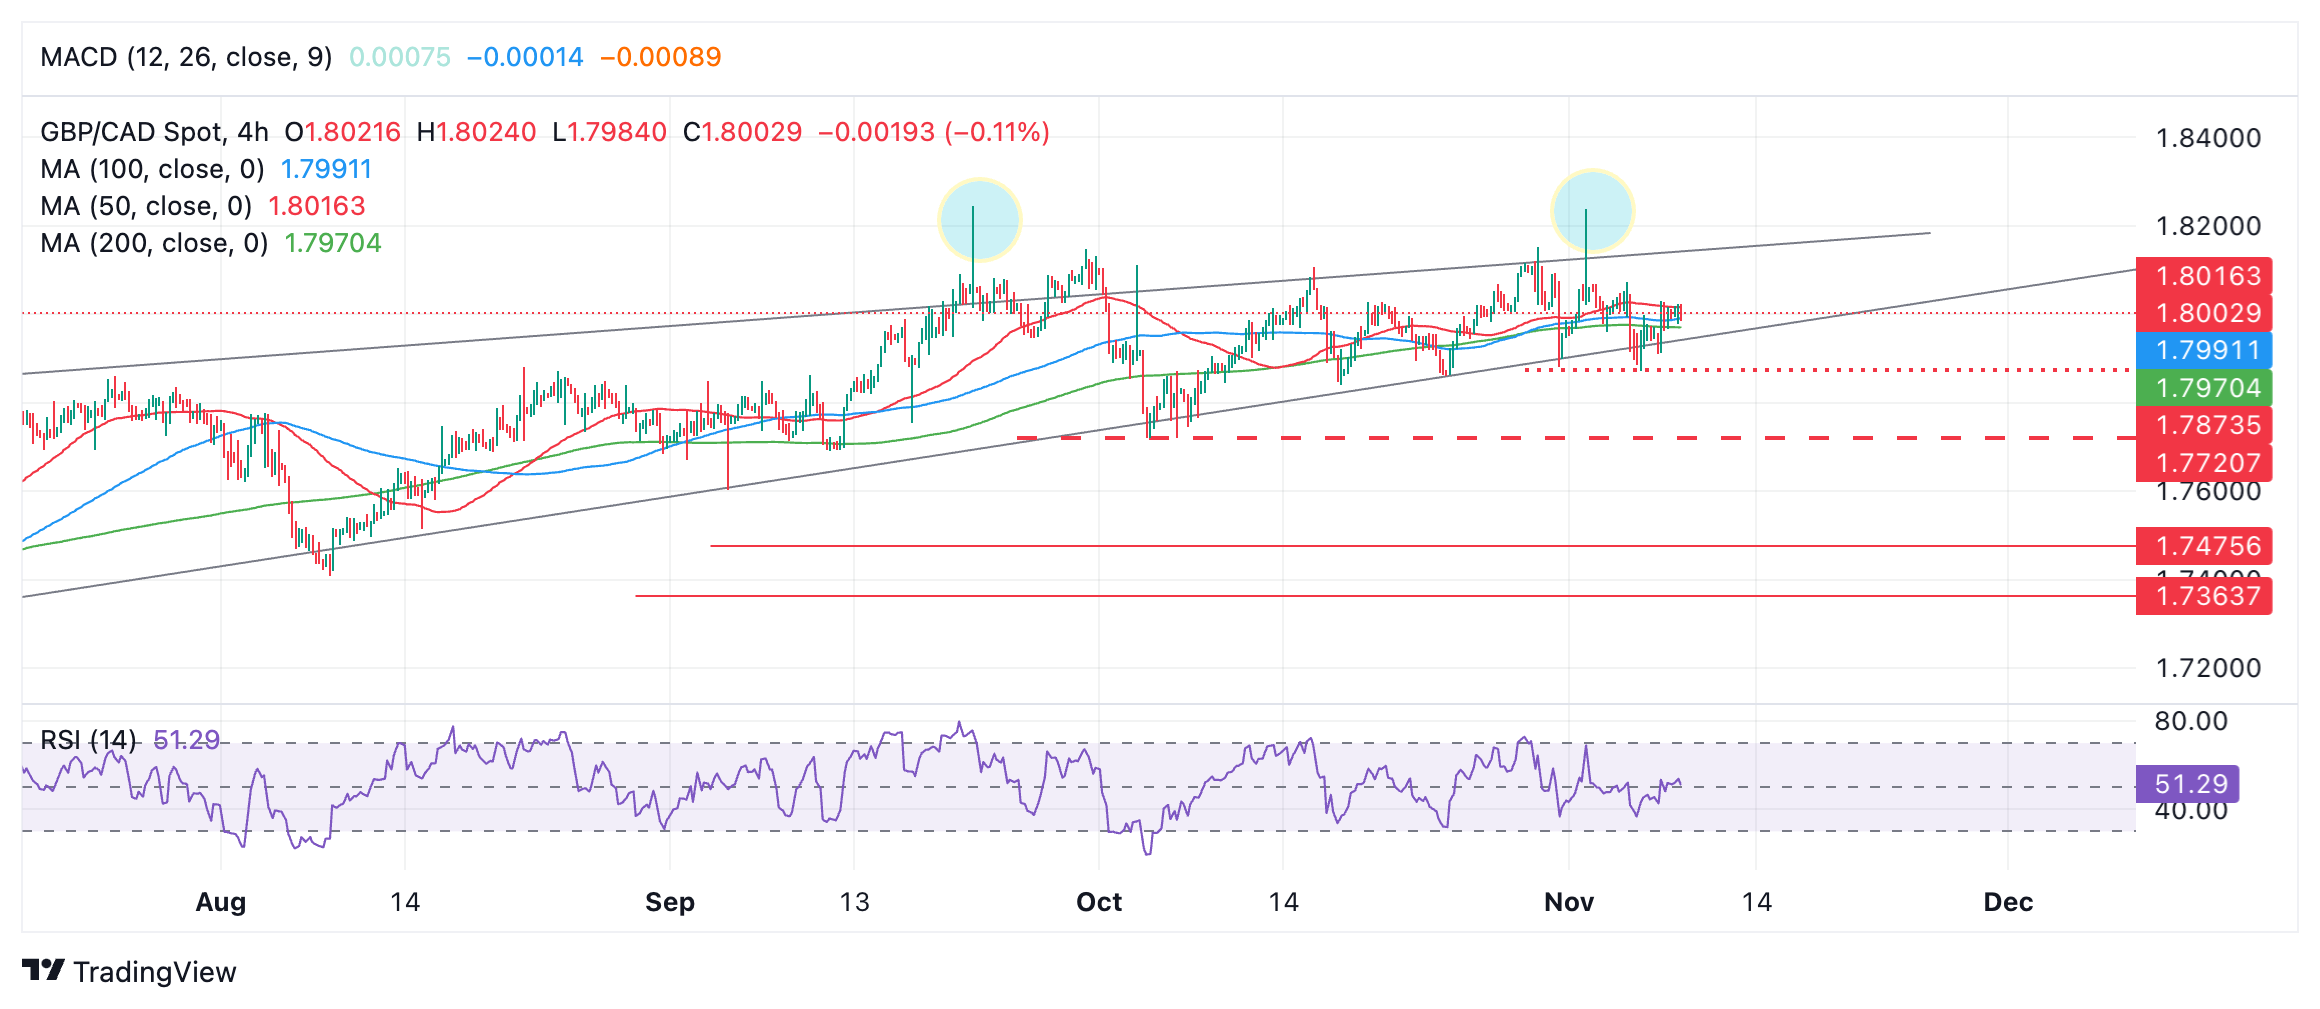
A break below the lower boundary line and then below 1.7871 (November 6 low) would probably confirm a decisive breakdown and lead to a decline to 1.7719, the October 3 swing low.
GBP/CAD broke temporarily above the upper guardrail of the Rising Wedge pattern on several occasions (blue circles on chart) on September 20 and November 1. This could be a sign of bullish exhaustion and an early warning of impending reversal.
Disclaimer: The information provided on this website is for educational and informational purposes only and should not be considered financial or investment advice.
Like
Recommended Articles



Featured Tools


Top News

The Week Ahead: Fed September Minutes, PepsiCo and Delta Earnings in Focus

MixVio AI Launches Unified Creative Workspace Across 26 AI Generation Routes

Wall Street puts a price on AI compute as miners pivot

Dell vs. Hewlett Packard Enterprise: Which AI Server Stock Is a Better Buy?

SIBIONICS and PharmaSens Explore New Horizons for Automated Insulin Delivery at EASD 2026

Comments (0)
Click the $ button, enter the symbol, and select to link a stock, ETF, or other ticker.