


Pi Network Price Forecast: Bullish breakout hopes fade as PI approaches record lows



- Pi Network approaches the $0.0704 record-low support on Wednesday before rebounding toward $0.0762, keeping downside risks in focus.
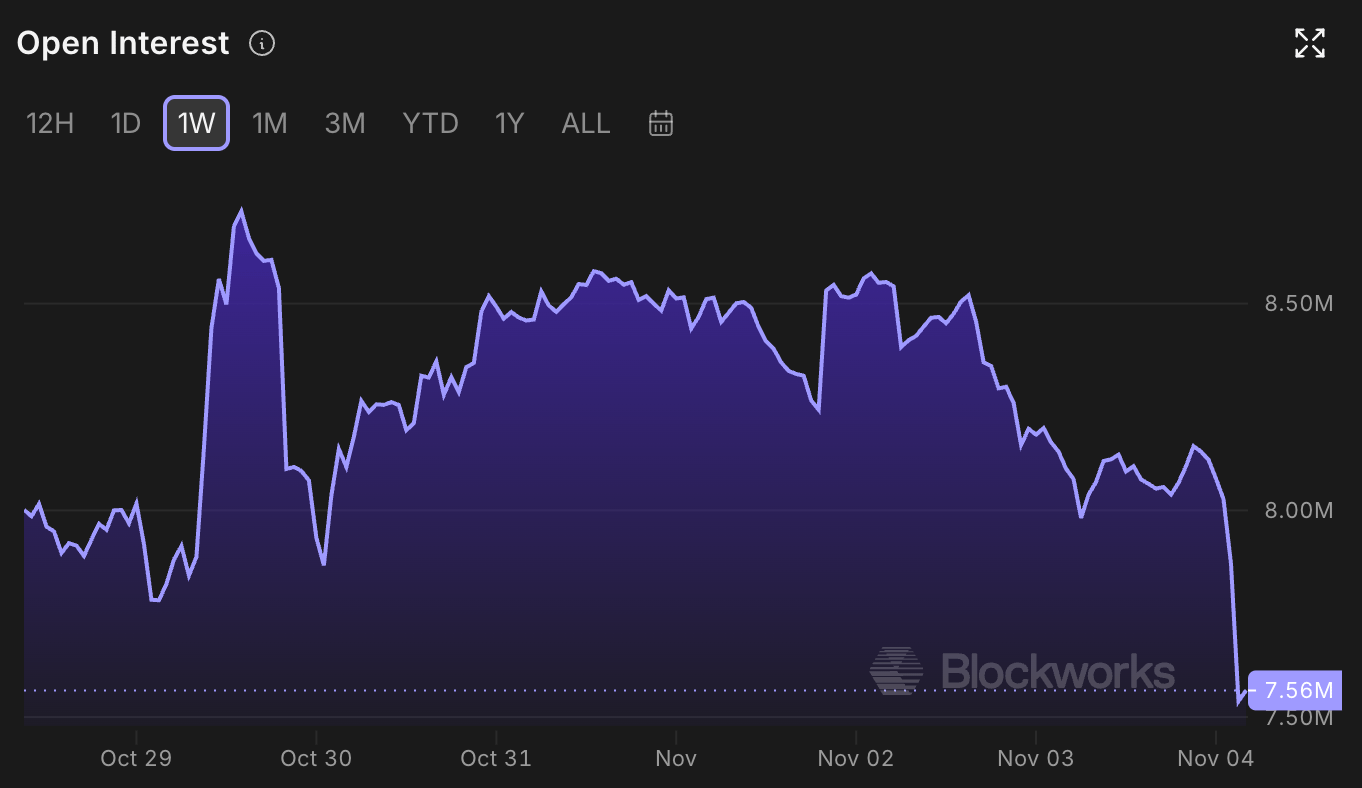
- PI futures Open Interest plunges to nearly $7.50 million, pointing to reduced activity in the derivatives market.
- The technical outlook for PI remains bearish, with downside momentum persisting.
Pi Network (PI) is trading in the red on Wednesday, hovering around $0.0755, with a downside risk toward the $0.0704 record low. The retail activity in the derivatives market declines as PI futures Open Interest plunges to nearly $7.50 million. The technical outlook for PI remains bearish, with downside momentum persisting.
PI loses traders' interest
Pi Network is losing its demand among derivatives traders. Blockworks data shows that PI futures Open Interest (OI) fell to $7.56 million on Wednesday, down from $8.16 million the previous day, suggesting a positional wipeout as the spot price declines. Typically, a drop in OI and the spot price suggests reduced risk appetite for the token, leading to weak activity in the derivatives market.
Technical outlook: Can PI avoid further losses?
Pi Network trades above $0.0760 after testing the $0.0700 round figure earlier in the day. PI defends the near-term support level at $0.0740 set by the October 15 low, as the price rejects lower levels.
Still, the PI token extends a bearish trend below both the 50-day and 200-day Exponential Moving Averages (EMAs) at $0.0822 and $0.1134, respectively. From a technical perspective, a downtrend resistance line, near $0.0779, reinforces the 50-day EMA barrier, keeping recovery attempts capped.
Momentum remains mixed, with the Moving Average Convergence Divergence (MACD) holding above the signal line in negative territory, while the Relative Strength Index (RSI) at 36 has flipped below the midline, suggesting that sellers still dominate.
Looking down, a confirmed breakout below the $0.0740 baseline could bring the Fibonacci anchor low around $0.0704 into focus, where buyers would be expected to defend the recent bearish cycle.
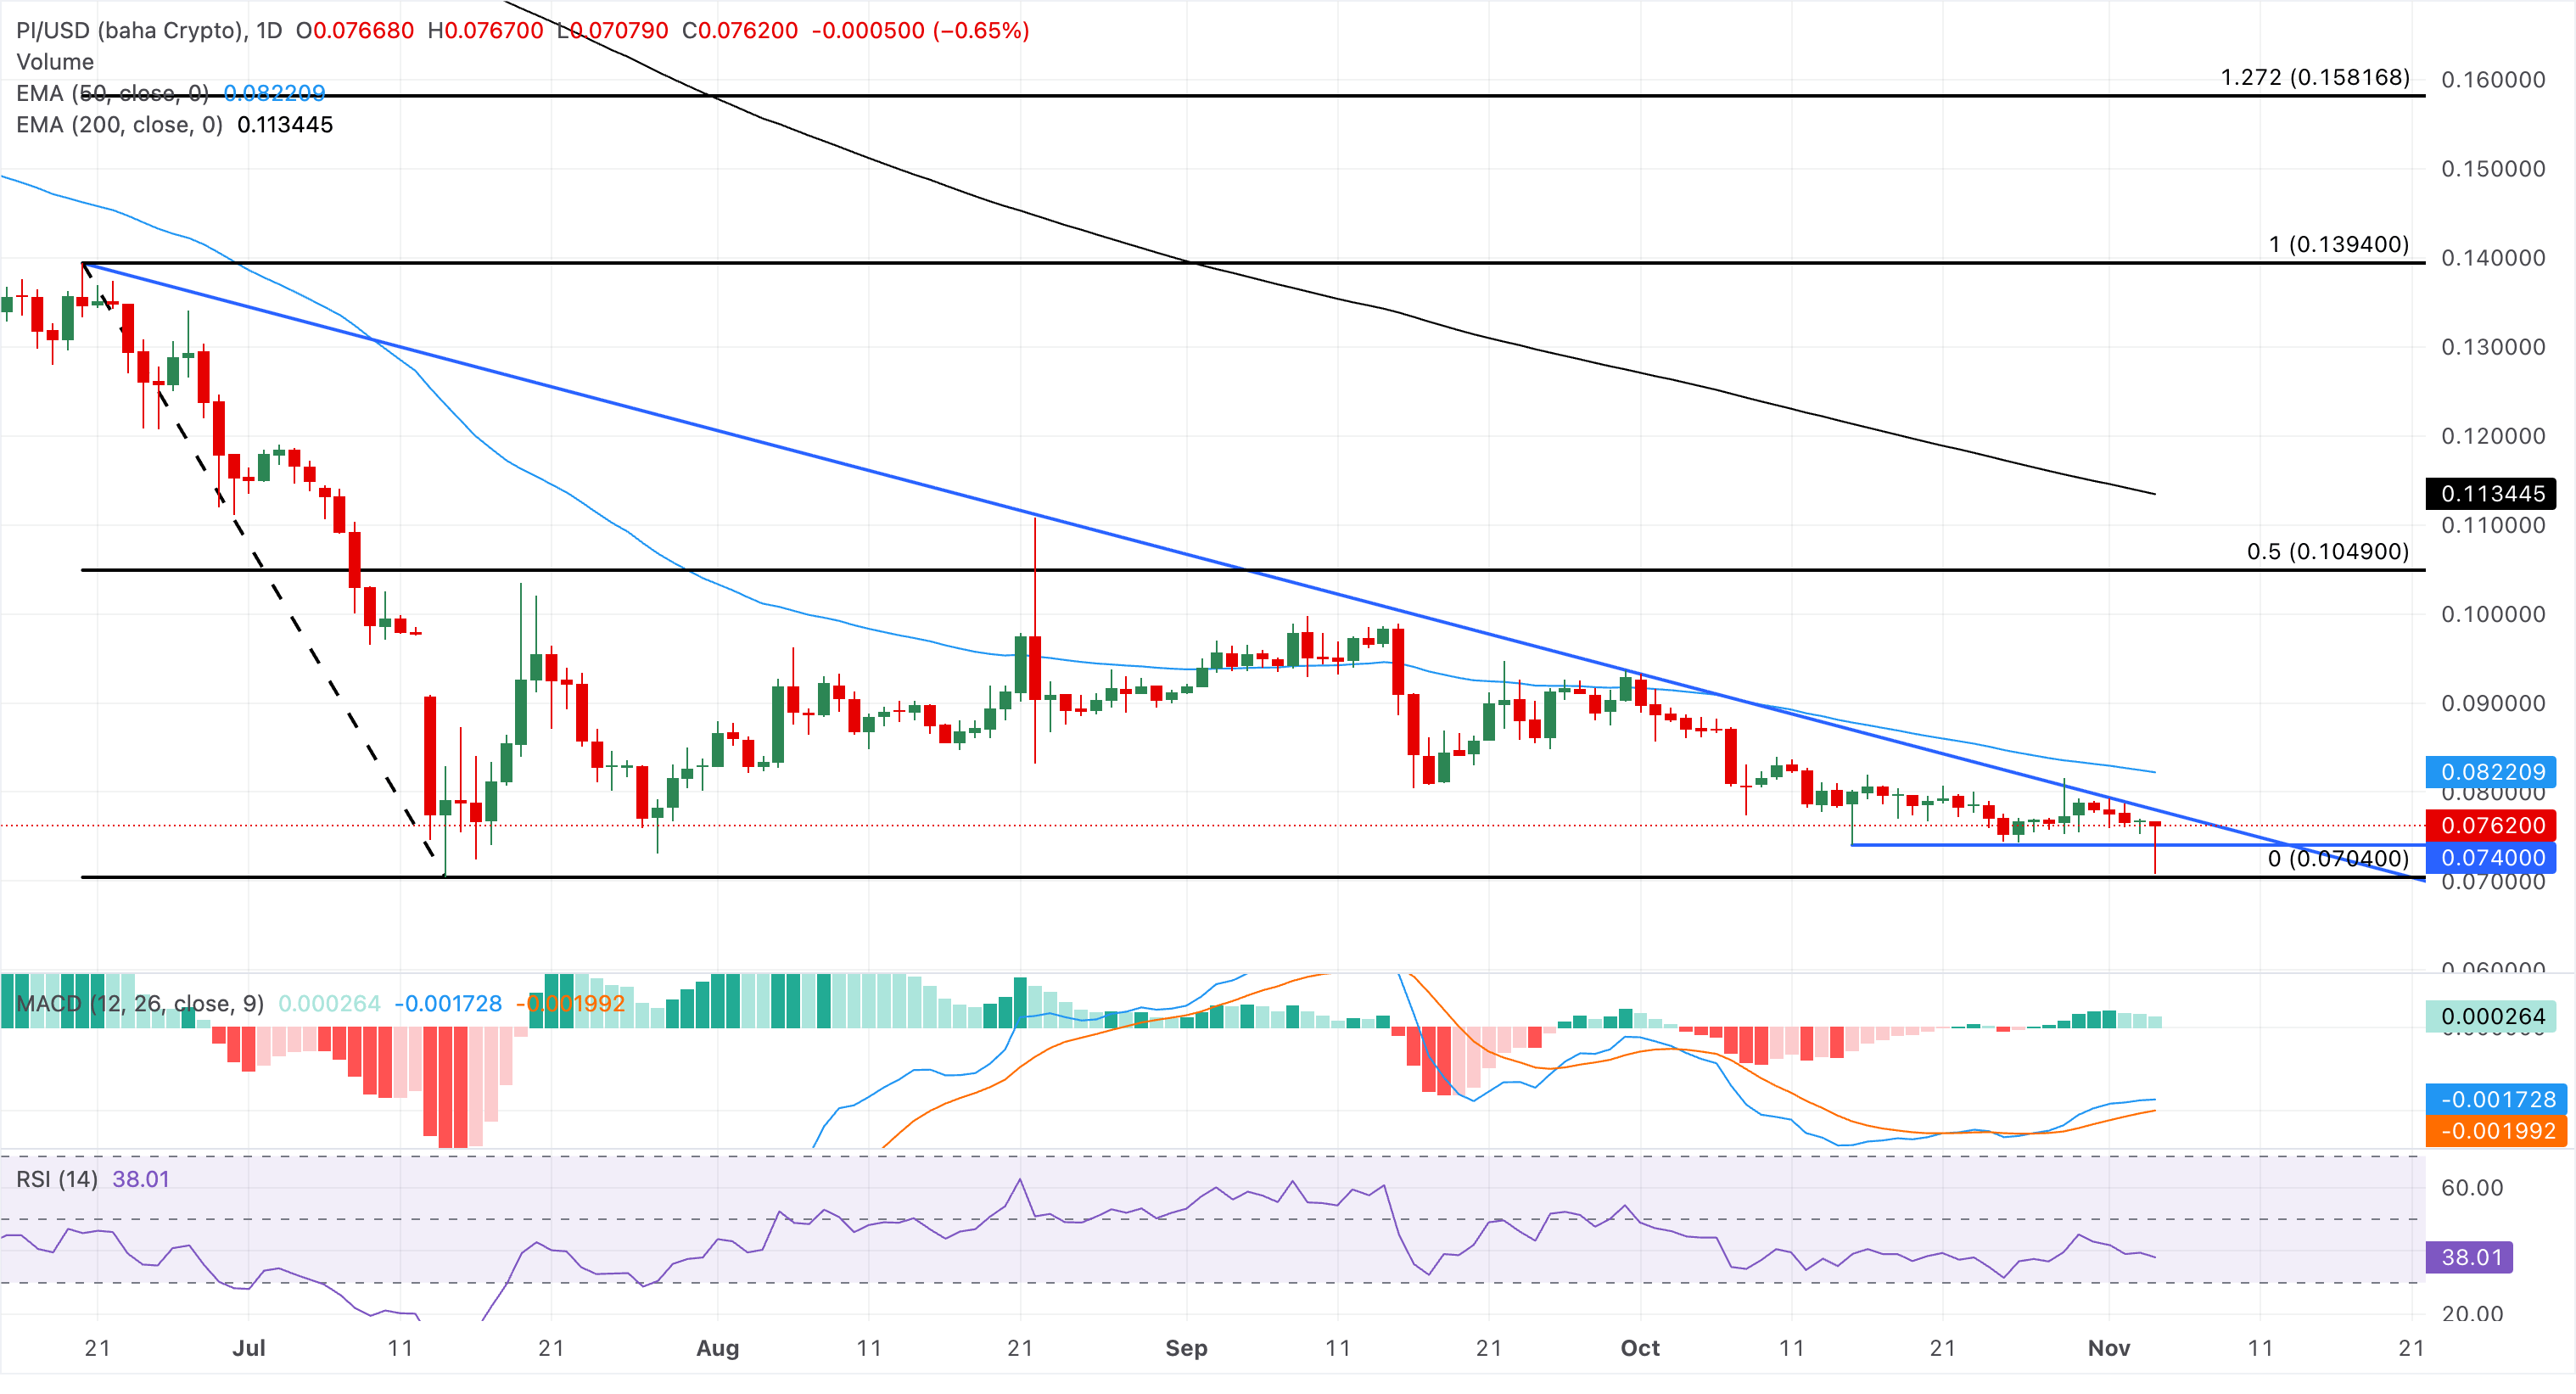
On the topside, initial resistance is seen at the trendline break area around $0.0779 and the 50-day EMA at $0.0822. A more meaningful hurdle aligns with the 50% retracement of the downswing from $0.1394 to $0.0704 at $0.1049.
(The technical analysis of this story was written with the help of an AI tool. Know more.)
Recommended Articles






Comments (0)
Click the $ button, enter the symbol, and select to link a stock, ETF, or other ticker.