


Cardano Price Forecast: Weak momentum puts ADA recovery at risk



- Cardano price trades below $0.222 on Thursday after failing to close above the 50-day EMA near $0.228 the previous day.
- Weakening derivatives metrics continue to cap ADA recovery.
- The technical outlook suggests fading momentum, with a close below the 100-day EMA support hinting at a deeper correction.
Cardano (ADA) is trading below $0.222 on Thursday after failing to sustain gains above the 50-day Exponential Moving Average (EMA) near $0.228 the previous day. Weakening derivatives metrics and fading bullish momentum continue to weigh on sentiment, while a break below the 100-day EMA could push ADA lower.
Weakening derivatives metrics cap Cardano
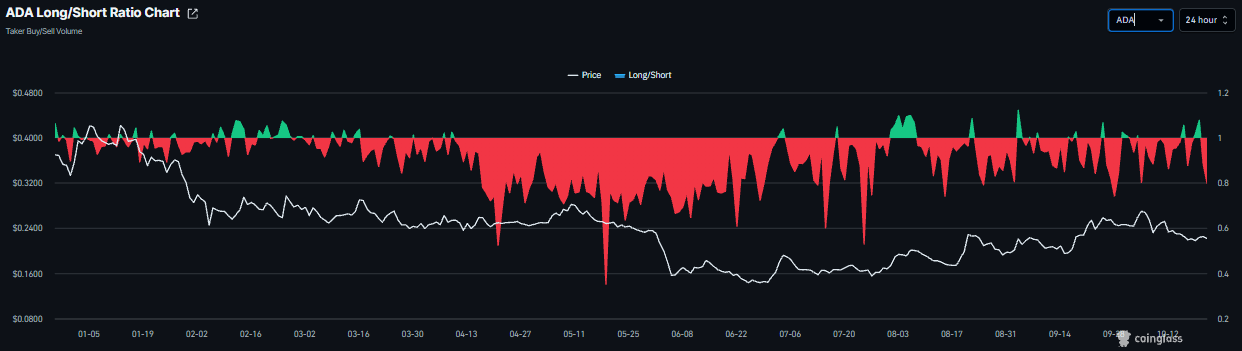
Derivatives data shows a cautious outlook for Cardano. CoinGlass’ long-to-short ratios for ADA read 0.79 on Thursday, nearing the lowest level over a month. A ratio below one indicates bearish sentiment, as traders bet that asset prices will fall.
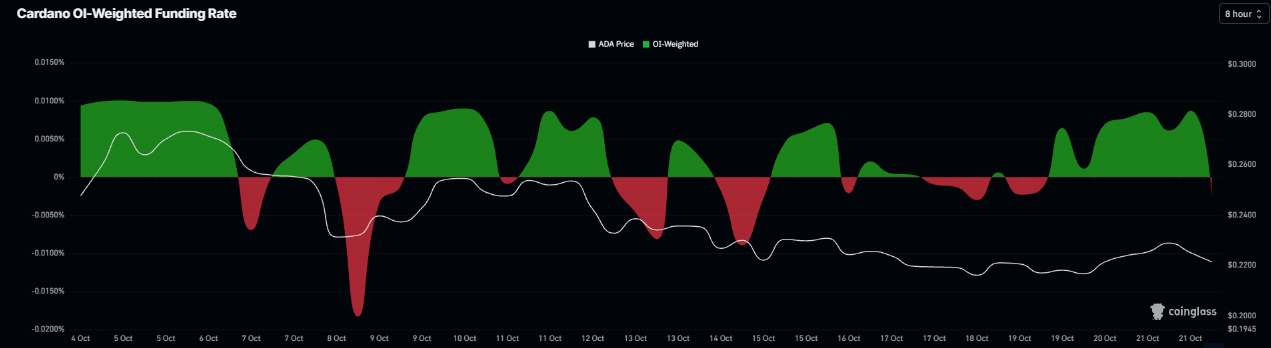
In addition, Cardano’s funding rate flipped negative on Wednesday, reading -0.0025% on Thursday, indicating shorts are paying longs and suggesting a bearish outlook.
On-chain data shows bearish bias
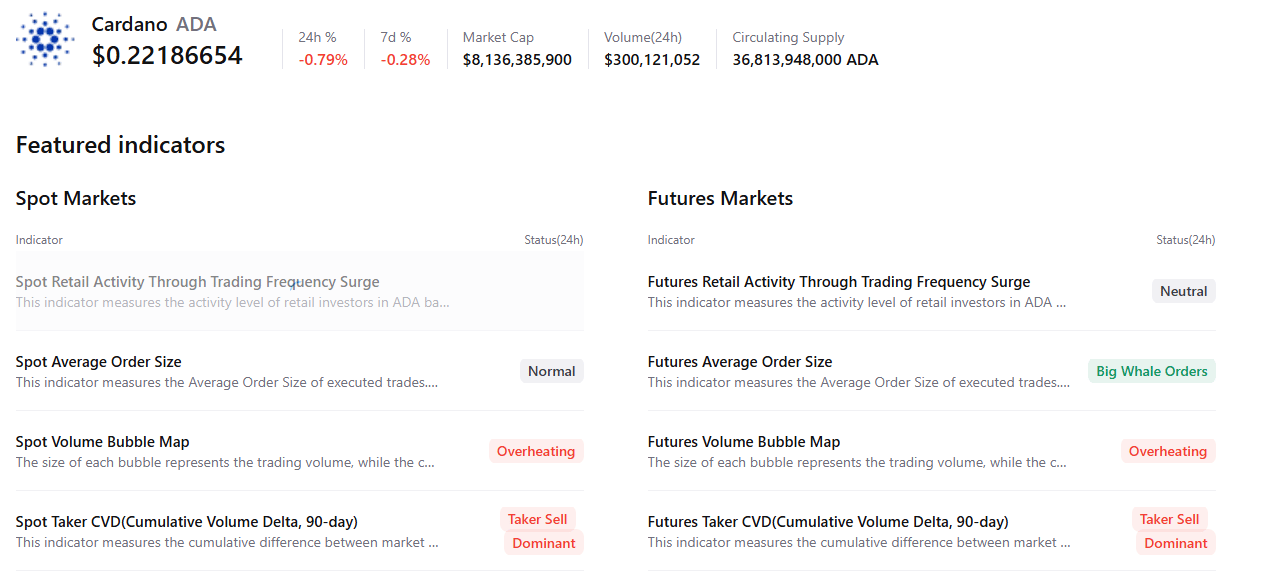
CryptoQuant’s summary data shows a bearish outlook for Cardano. ADA’s futures markets show large whale orders alongside heating conditions. In addition, the spot and futures markets show sell-side dominance. These highlight a bearish, cautious sentiment bias among Cardano traders.
Cardano technical outlook: Weakening momentum indicators
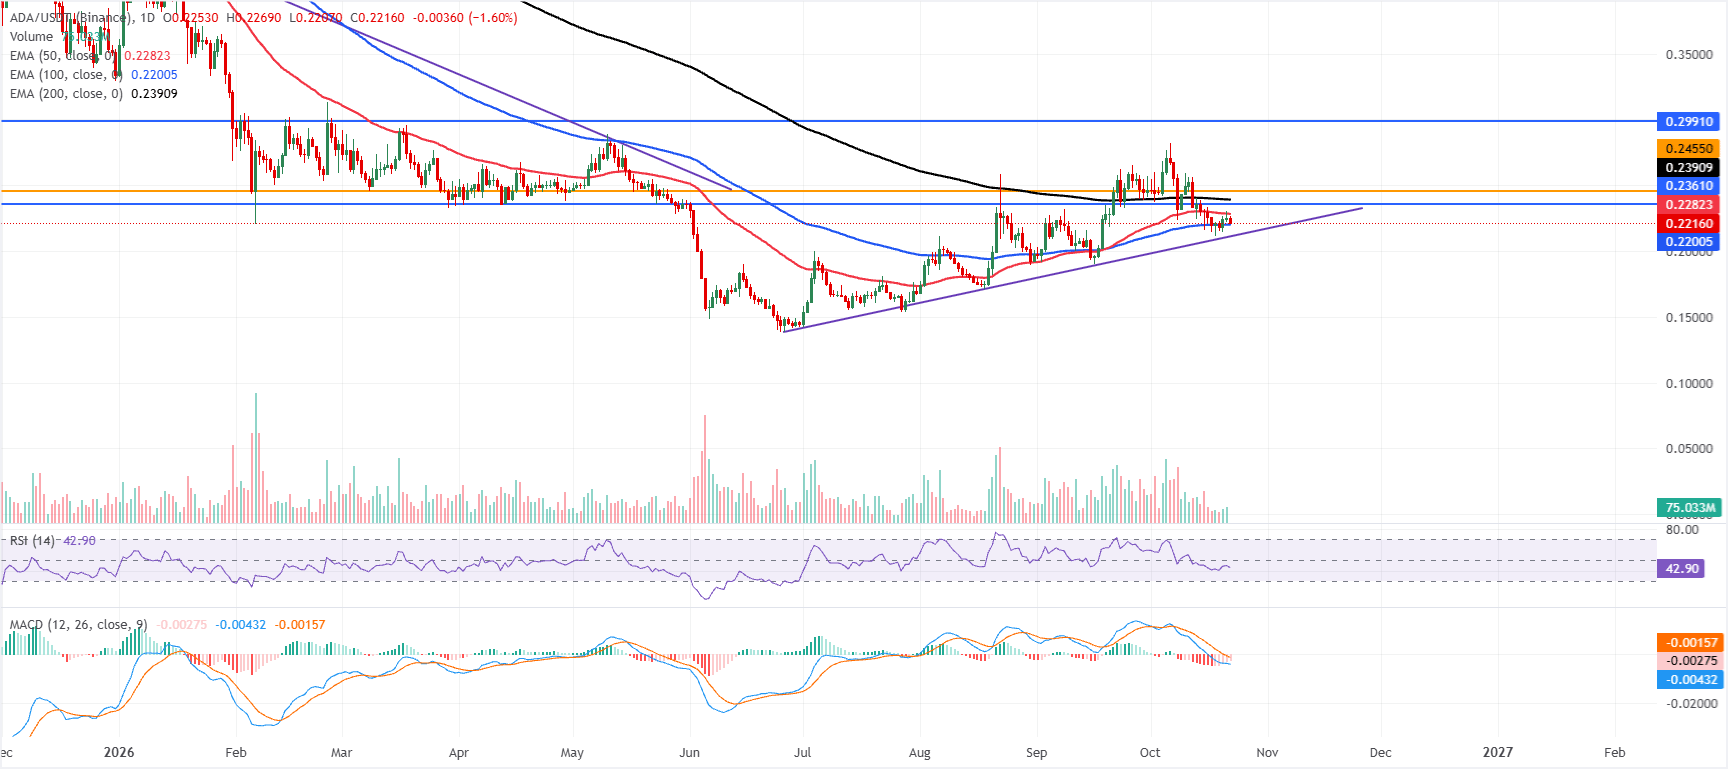
Cardano price trades at $0.221 on Thursday, holding below its 50-day and 200-day Exponential Moving Averages (EMAs), which keeps the near-term bias tilted to the downside. ADA is hovering just above the 100-day EMA around $0.220, while the break of the rising support trend line near $0.210 hints that the broader corrective phase remains in play.
Momentum indicators back this cautious tone, with the Relative Strength Index (RSI) lingering in the low-40s and the Moving Average Convergence Divergence (MACD) still negative, suggesting downside pressure is fading but not yet reversed.
On the topside, initial resistance appears at the 50-day EMA near $0.230, followed by a horizontal barrier around $0.236 and the 200-day EMA near $0.240, with a stronger cap toward $0.250 and then $0.300.
On the downside, immediate support is reinforced by the 100-day EMA around $0.220, ahead of the former uptrend line-break region near $0.210; a sustained drop through that area would expose deeper trendline-memory support closer to $0.170.
(The technical analysis of this story was written with the help of an AI tool. Know more.)
Recommended Articles








Comments (0)
Click the $ button, enter the symbol, and select to link a stock, ETF, or other ticker.