


Zcash Price Forecast: ZEC poised for a rebound as momentum recovers



- Zcash is up 4% on Wednesday, mirroring the previous day's 4% gain.
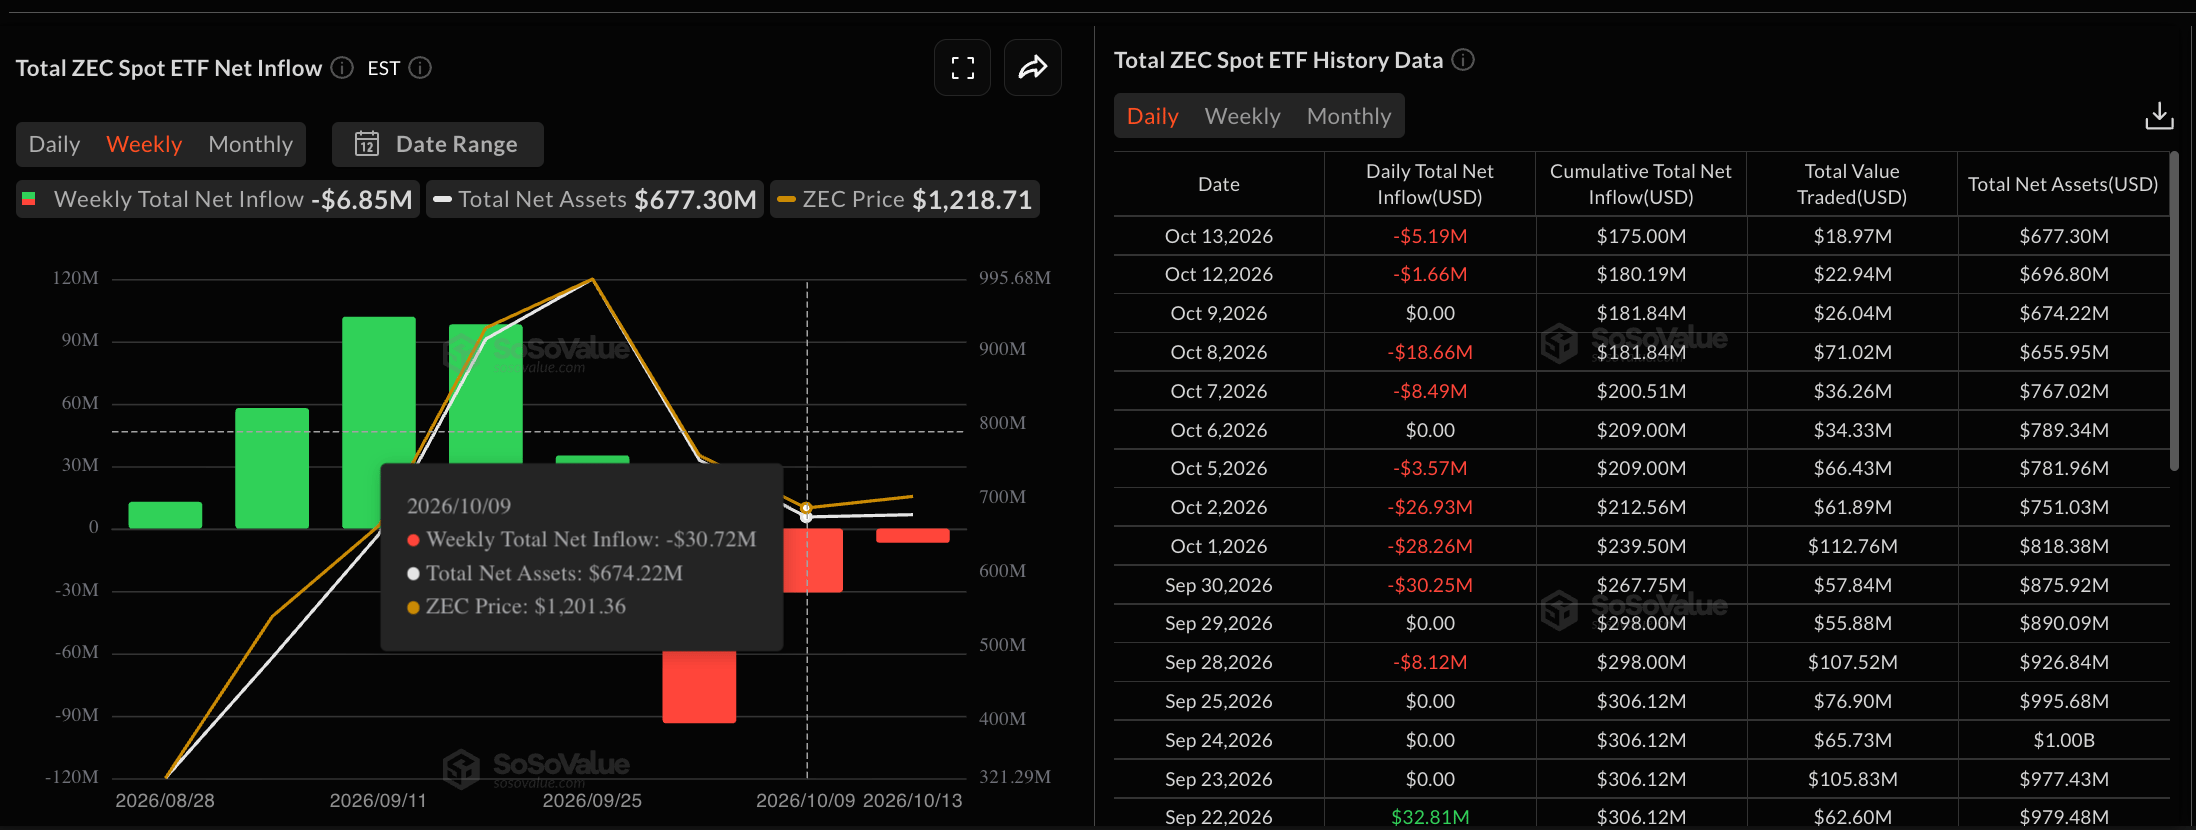
- ZEC ETFs recorded over $5 million in outflows on Tuesday, facing steady selling pressure after last week’s $30 million in redemptions.
- The technical outlook for ZEC is mixed, as near-term momentum gains strength.
Zcash (ZEC) is up 4% on Wednesday, extending the 4% rise from the previous day and paring Monday’s 8% loss. Grayscale’s ZEC-focused Exchange-Traded Fund (ETF) is facing selling pressure, with over $5 million in outflows on Tuesday. The technical outlook for ZEC is now mixed, with a bearish bias as upside momentum gains strength.
Grayscale’s ZCSH fund faces constant selling pressure
The sole Zcash-focused ETF from Grayscale, ZCSH, has been under persistent selling pressure since late September, coinciding with the 3-for-1 stock split on September 30. SoSoValue data shows ZCSH recorded $5.19 million in outflows on Tuesday, following $1.66 million on Monday and $30.72 million last week. The steady outflows reflect increased investor redemptions of ETF shares, weighing on the privacy coin’s spot demand.
Technical outlook: Zcash recovery gains momentum
Zcash trades around $1,264 at press time on Wednesday, holding steady in a recovery from the previous day's low of $1,123. The privacy coin tests the declining 50- and 200-period Exponential Moving Averages (EMAs) on the four-hour chart at $1,261 and $1,269, respectively, keeping the near-term tone neutral to mildly capped.
The Relative Strength Index (RSI) at 54 suggests modest positive momentum above the midline, and the Moving Average Convergence Divergence (MACD) line is marginally above the signal line, hinting at a tentative bullish bias.
On the topside, initial resistance is located at the 50- and 200-period EMAs near $1,261 and $1,269, respectively, where a sustained break would open the way for upside. Still, ZEC must reclaim the $1,320 peak formed on Monday on the four-hour chart for a more convincing recovery. Beyond which, the September 18 low at $1,422 could serve as the next bullish target.
On the downside, the immediate pivot is at Thursday's low of $1,115, followed by the September 4 high near $1,050, which is reinforced by the $1,000 psychological support.
(The technical analysis of this story was written with the help of an AI tool. Know more.)
Recommended Articles









Comments (0)
Click the $ button, enter the symbol, and select to link a stock, ETF, or other ticker.