


Starknet Price Forecast: STRK rally tests key breakout amid proposed Layer-1 transition



- Starknet is up 16% so far on Friday, advancing the 13% rally from the previous day.
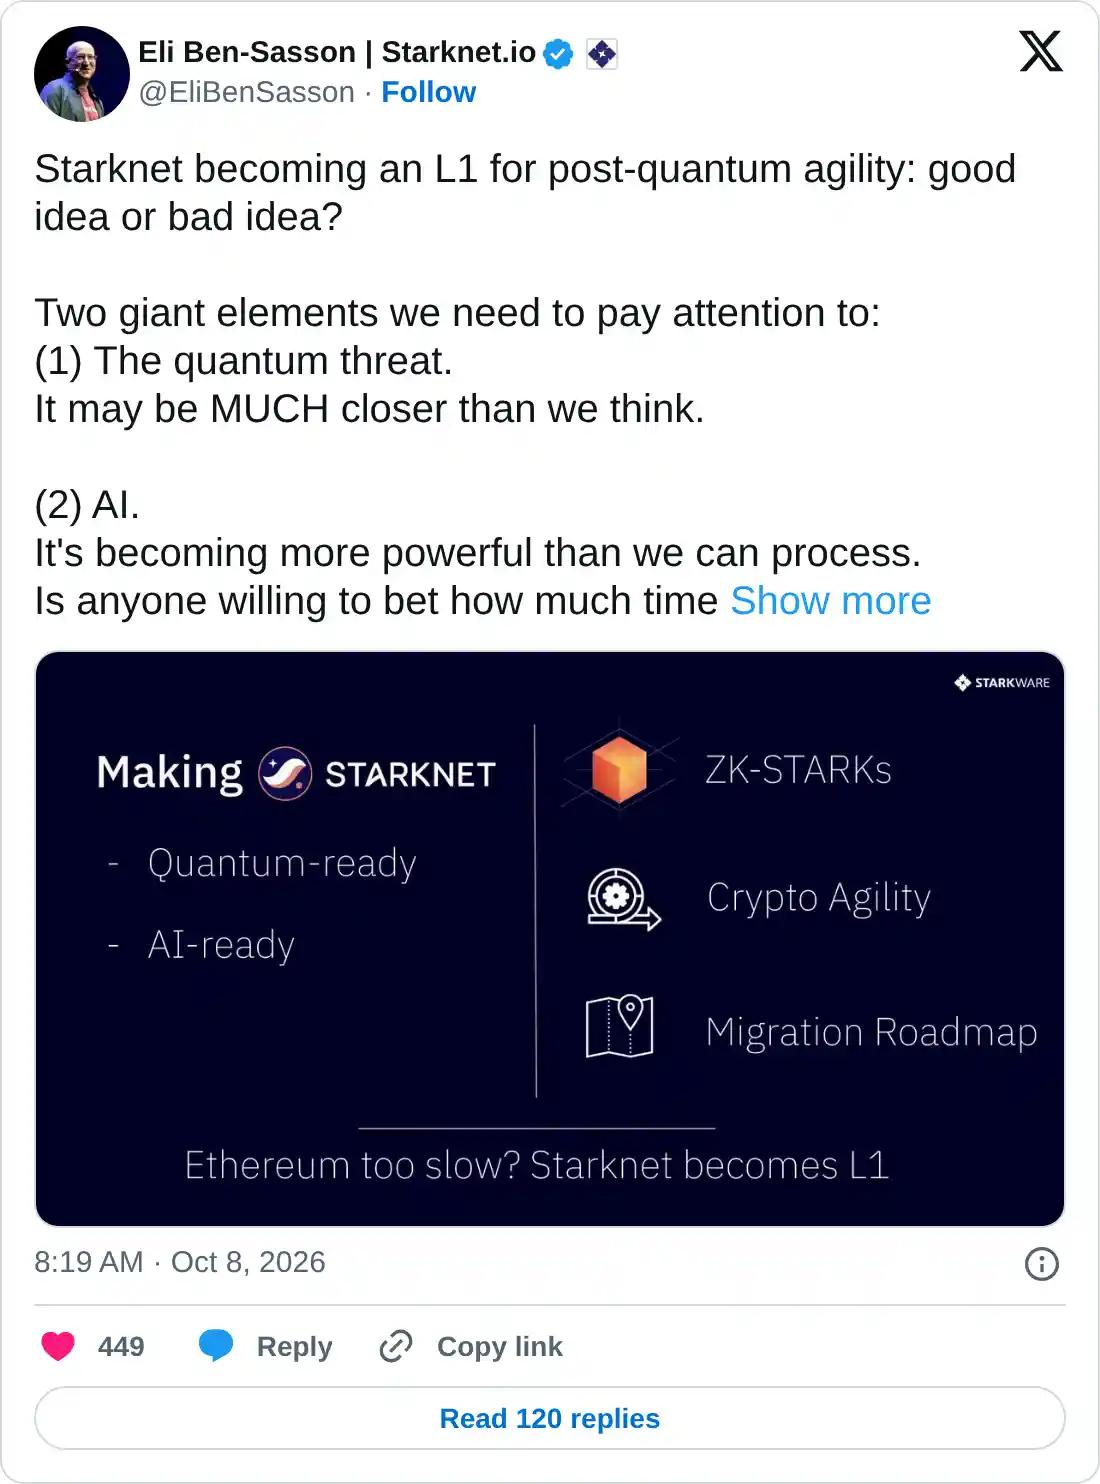
- Eli Ben-Sasson, CEO of StarkWare, proposed transitioning Starknet to Layer-1 to achieve quantum security by 2027.
- The technical outlook for STRK is bullish, with bulls focused on breaking above the eight-month-long resistance level near $0.05940.
Starknet (STRK) is up 16% so far on Friday, advancing its steady recovery of nearly 200% since mid-August. The rally aligns with the rising demand for financial anonymity in the cryptocurrency market and the CEO of StarkWare, Eli Ben-Sasson’s proposed transition of Starknet to Layer-1 to achieve quantum security by 2027. The technical outlook for STRK is bullish, suggesting upside potential toward the $0.1000 psychological milestone.
Starknet poised for Layer-1 transition to achieve quantum safety
Eli Ben-Sasson, CEO of StarkWare, the parent company of the decentralized layer-2 protocol Starknet, proposed a potential upgrade to the Layer-1 network in a social media post on Thursday. This upgrade will transition Starknet from Ethereum’s network to its own and focus on achieving security from quantum-computing and AI-related threats.
Technical outlook: Starknet rally eyes $0.10 as bullish pressure mounts
Starknet trades at an eight-month high above $0.06400 at press time on Friday, extending a strong bullish phase from the August 18 low of $0.02222. The STRK token price holds well above the 50-, 100-, and 200-day Exponential Moving Averages (EMAs) at $0.03945, $0.03604, and $0.04127, respectively, hinting at a constructive underlying trend.
From a technical perspective, STRK's rally tests the bullish breakout above the February 3 high of $0.05970, which previously capped gains at the May 7 high of around $0.05944. A Fibonacci retracement from the May 7 high at $0.05944 to the August 22 low at $0.02222 highlights the 127.2% and 161.8% extension levels at $0.07768 and $0.10918, respectively, if price secures a bullish close above $0.06000.
Momentum on the daily chart warns of an overstretched rally, with the Relative Strength Index (RSI) around 72 in overbought territory, while the Moving Average Convergence Divergence (MACD) remains positive, holding above its signal line, suggesting firm bullish momentum.
On the downside, initial support is seen at the former swing area around the $0.05000 psychological threshold, reinforced by Wednesday's low around $0.04825. Any deeper pullback could expose the 200-day EMA at $0.04127.
(The technical analysis of this story was written with the help of an AI tool. Know more.)
Recommended Articles









Comments (0)
Click the $ button, enter the symbol, and select to link a stock, ETF, or other ticker.