


Pi Network Price Forecast: PI stalls near key resistance as risk-on sentiment holds



- Pi Network is up nearly 2% on Tuesday, testing a bullish breakout above its 50-day EMA at $0.091.
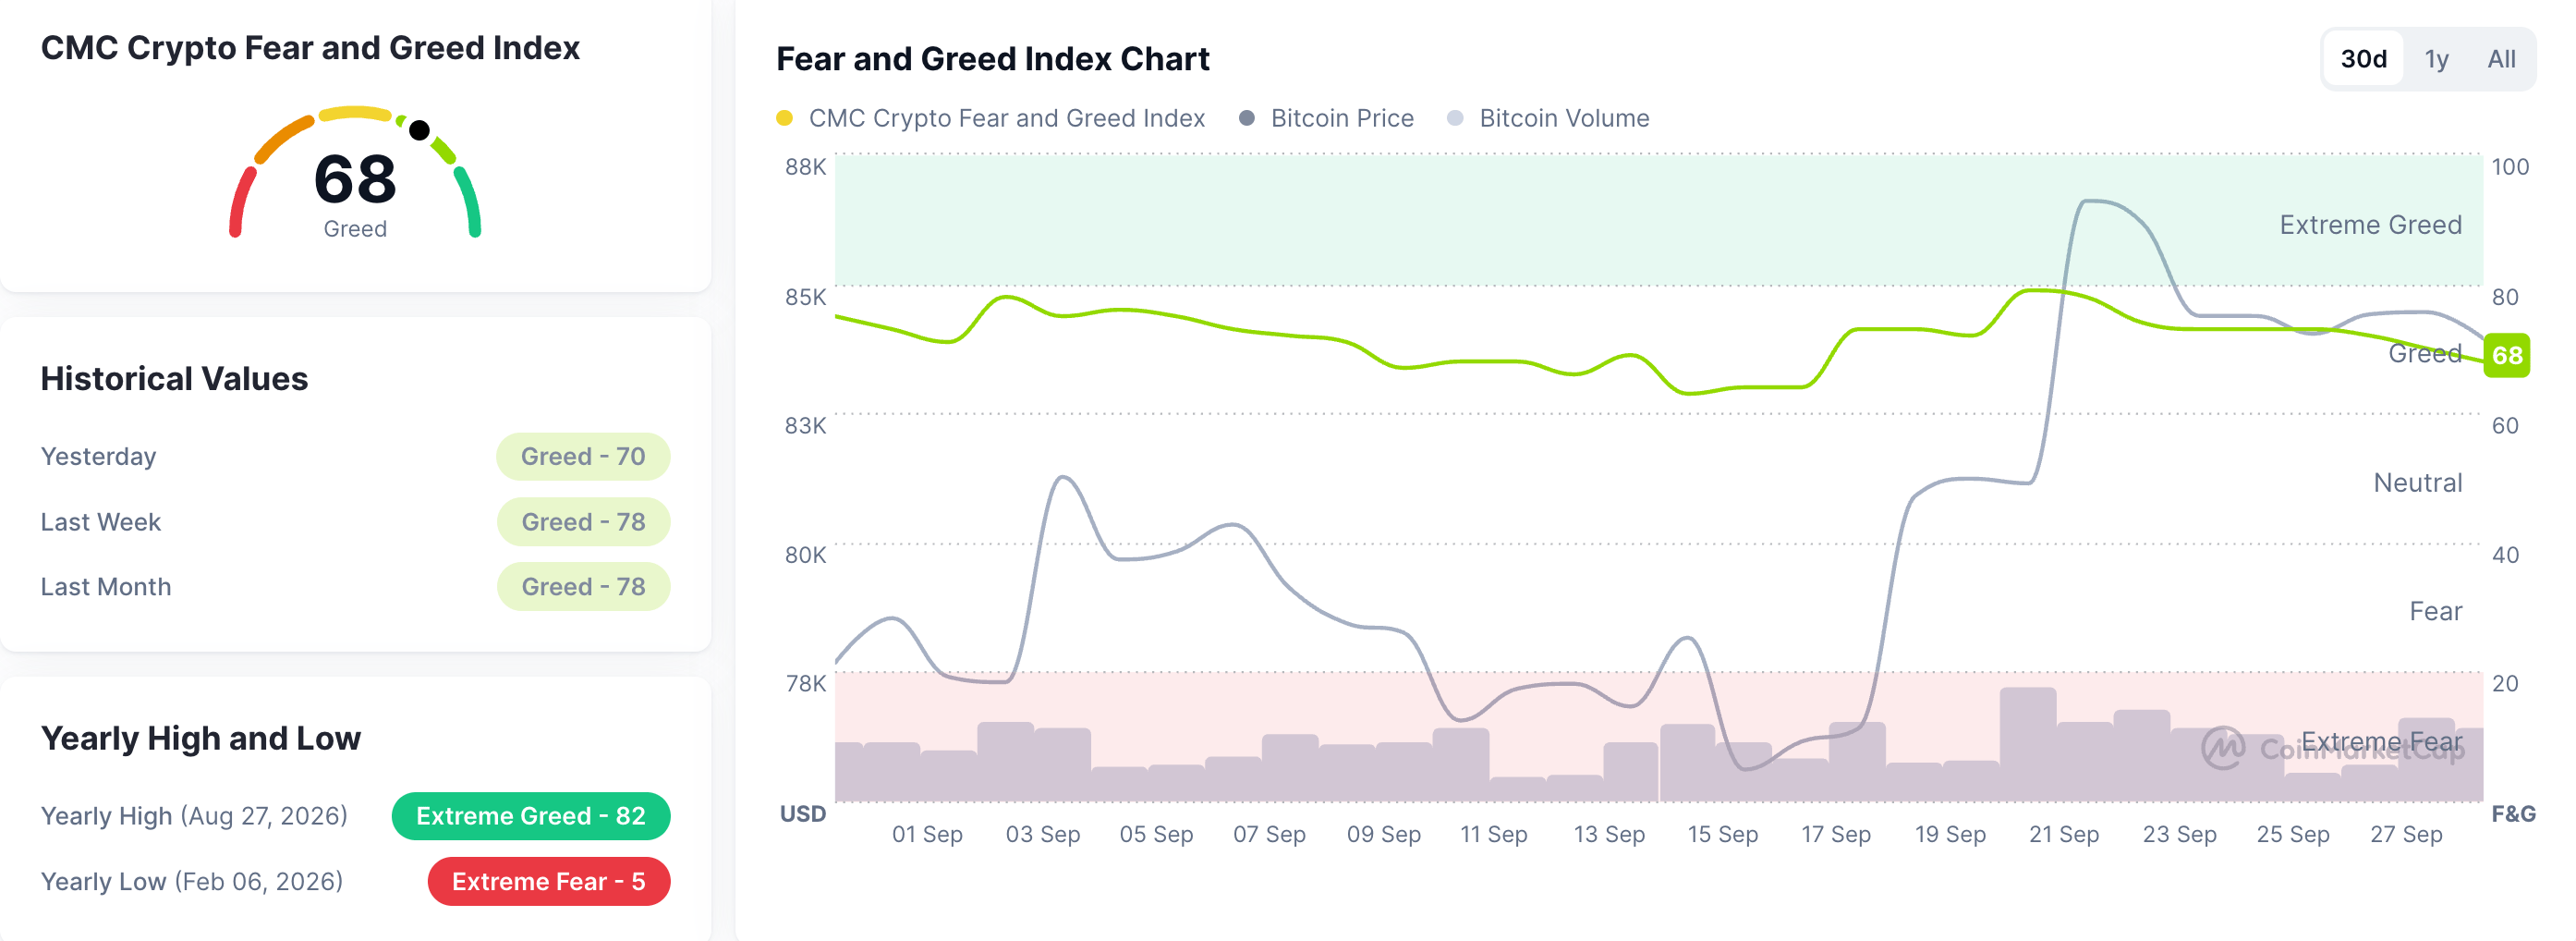
- The broader cryptocurrency market maintains a risk-on tone, with the Fear and Greed Index at 68.
- The technical outlook for PI is mixed, with momentum indicators showing neutral signals.
Pi Network (PI) shows a mild recovery of nearly 2% on Tuesday, after losing over 2% the previous day. The broader cryptocurrency market retains a risk-on tone, hinting at potential upside for altcoins. PI token must surpass its 50-day Exponential Moving Average (EMA) at $0.0917 to reclaim near-term bullish tone.
Broader market sentiment backs upside potential
CoinMarketCap’s Fear and Greed Index stands at 68 on Tuesday, down from 78 last week but remains well above the neutral zone, suggesting persistent risk-on market sentiment. A sustained bullish tone in the broader crypto market could fuel investors’ risk appetite for the PI token amid the upcoming v28 protocol upgrade, as previously reported by FXStreet.
Technical outlook: Pi Network capped key resistance cluster
Pi Network price hovers around $0.09050 at press time on Tuesday, maintaining a bearish near-term bias as it holds below its 50-day EMA at $0.0917, which serves as the immediate resistance. The 100-day EMA at $0.1008 and the 200-day EMA at $0.1337 hold far above the price, reinforcing a broader downtrend.
A confirmed breakout above the 50-day EMA at $0.0917 could target the 50% retracement of the downswing from $0.1341 to $0.0704, at $0.0990,which is reinforced by the 100-day EMA at $0.1008.
Momentum is more balanced, with the Relative Strength Index (RSI) hovering around 50 on the daily chart, while the Moving Average Convergence Divergence (MACD) is holding just above its signal line, suggesting consolidation rather than a clear reversal.
On the downside, immediate support aligns with the 23.6% Fibonacci retracement at $0.0827, while a deeper slide would expose the structural floor around the cycle low near $0.0704.
(The technical analysis of this story was written with the help of an AI tool. Know more.)
Recommended Articles









Comments (0)
Click the $ button, enter the symbol, and select to link a stock, ETF, or other ticker.