


Top Altcoins Price Forecast: Ripple, Cardano, Solana extend consolidation as bullish momentum fades



- Ripple consolidates above the 200-day EMA at $1.3550, struggling to extend its rally above the $1.50 psychological threshold.
- Cardano remains capped below the 200-day EMA at $0.2449, maintaining a long-term corrective tone.
- Solana struggles to hold the $100 psychological support as momentum indicators point to easing upside pressure.
Ripple (XRP), Cardano (ADA), and Solana (SOL) maintain a consolidative tone, struggling to sustain their upside momentum. The technical outlook for XRP, ADA, and SOL suggests downside risk as altcoins struggle to advance their August gains.
Ripple holds above its 200-day EMA
Ripple trades around $1.40 at press time on Tuesday, holding a constructive bias above its 200-day Exponential Moving Average (EMA) at $1.3550. The altcoin also hovers above the 50% Fibonacci retracement of the $0.9862 to $1.6999 upswing at $1.3430, underpinning the broader uptrend.
Momentum shows early signs of easing on the daily chart with the Moving Average Convergence Divergence (MACD) slipping below its signal line, while the Relative Strength Index (RSI) is around 59, reaffirming that momentum is moderating.
On the topside, resistance aligns first at the 78.6% Fibonacci retracement at $1.5129, with further hurdles at the recent swing high around $1.6999, levels that bulls would need to reclaim to reassert a stronger upward extension.
On the downside, immediate support is seen at the 200-day EMA near $1.3550, followed by the 50% retracement at 1.3430, with deeper cushions at the 61.8% level at 1.2588 and the 78.6% retracement around 1.1389 if sellers extend a correction.
Cardano capped below long-term resistance
Cardano holds a constructive near-term tone above the 50-day and 100-day EMAs at roughly $0.1978 and $0.2000, respectively. Still, ADA remains below the resistance cluster formed by the 200-day EMA at $0.2449 and the 78.6% Fibonacci retracement at $0.2465, measured from $0.2887 to $0.1382.
A confirmed breakout above this zone could extend the rally toward the $0.2887 swing high, followed by the 127.2% Fibonacci extension at $0.3527.
The RSI around 59 suggests mild neutral-to-bullish momentum, while the MACD and signal line show a modest positive slope, hinting that upside pressure could be easing.
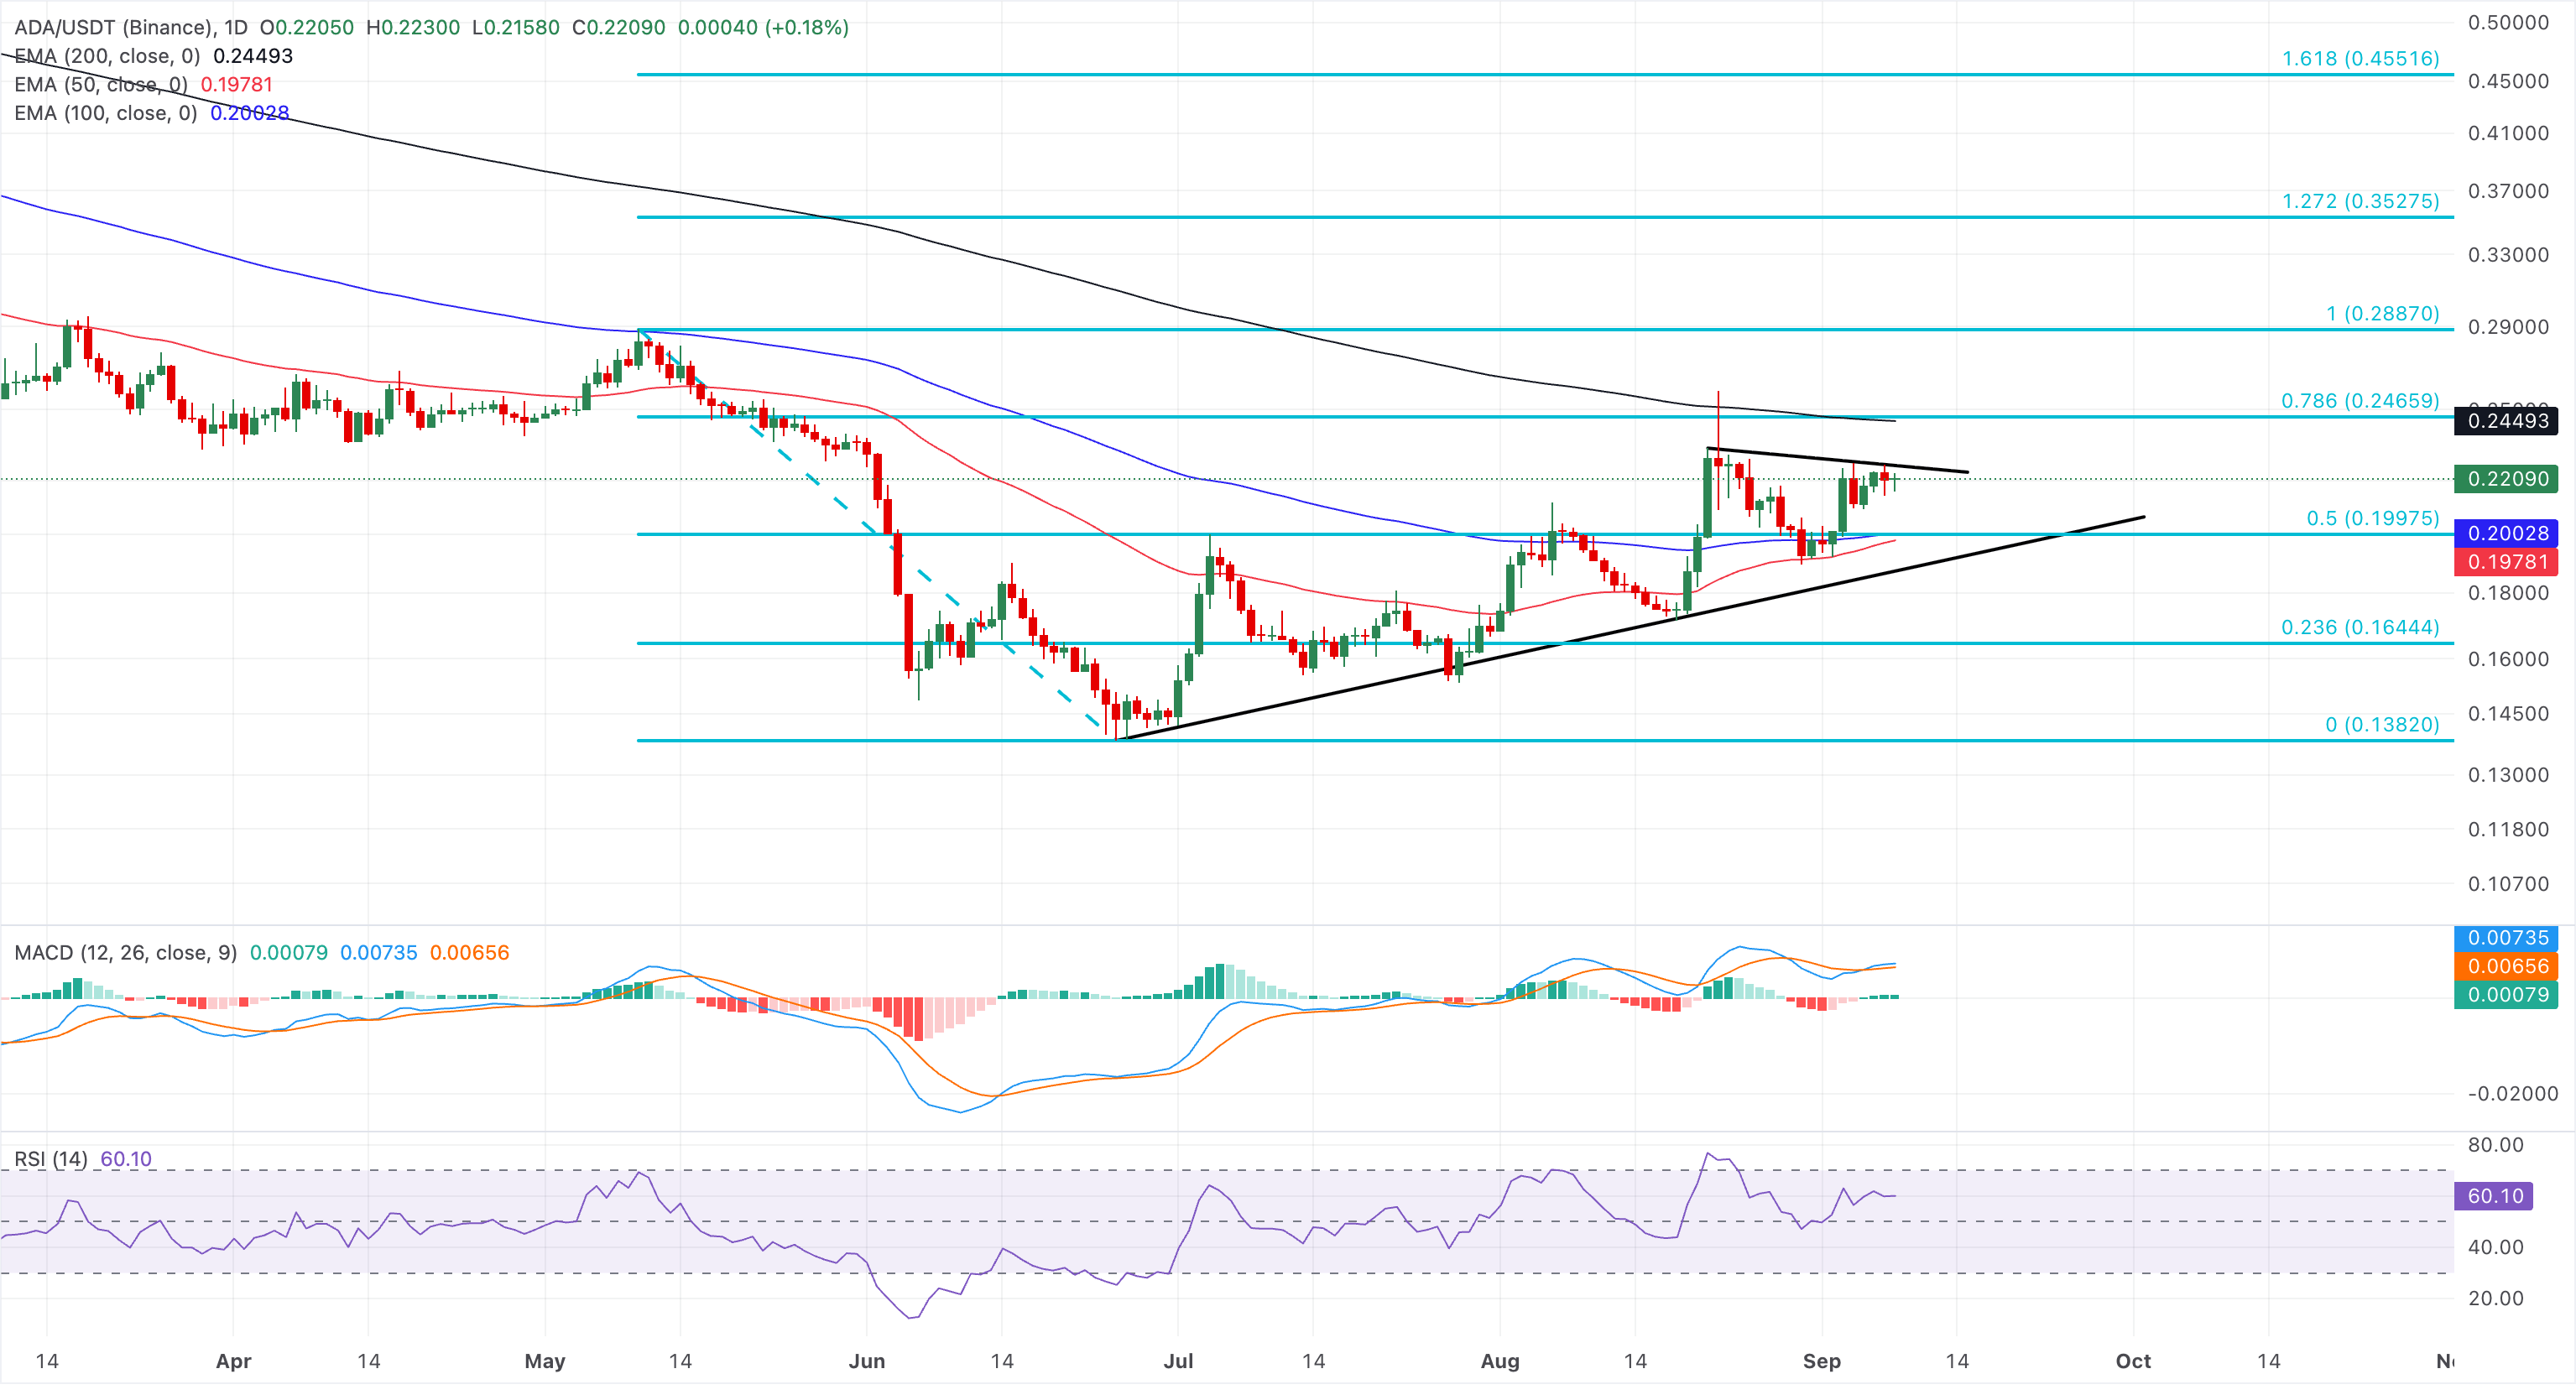
Looking down, initial support is aligned at the 50% retracement at $0.1997, backed by the 100-day EMA at $0.2002 and the 50-day EMA at $0.1978.
Solana loses strength above $100
Solana trades around $103 on Tuesday, maintaining a constructive bullish bias as the price remains well above the 50-day, 100-day, and 200-day EMAs, which are clustered between roughly $85.80 and $90.95. This elevated positioning suggests the broader uptrend is intact.
From a technical perspective, Solana must surpass the December 16 low at $116, followed by the January 13 high at $148.
The RSI has eased back from prior overbought territory to a still-firm 62, while the MACD has slipped below its signal line, hinting at waning upside momentum.
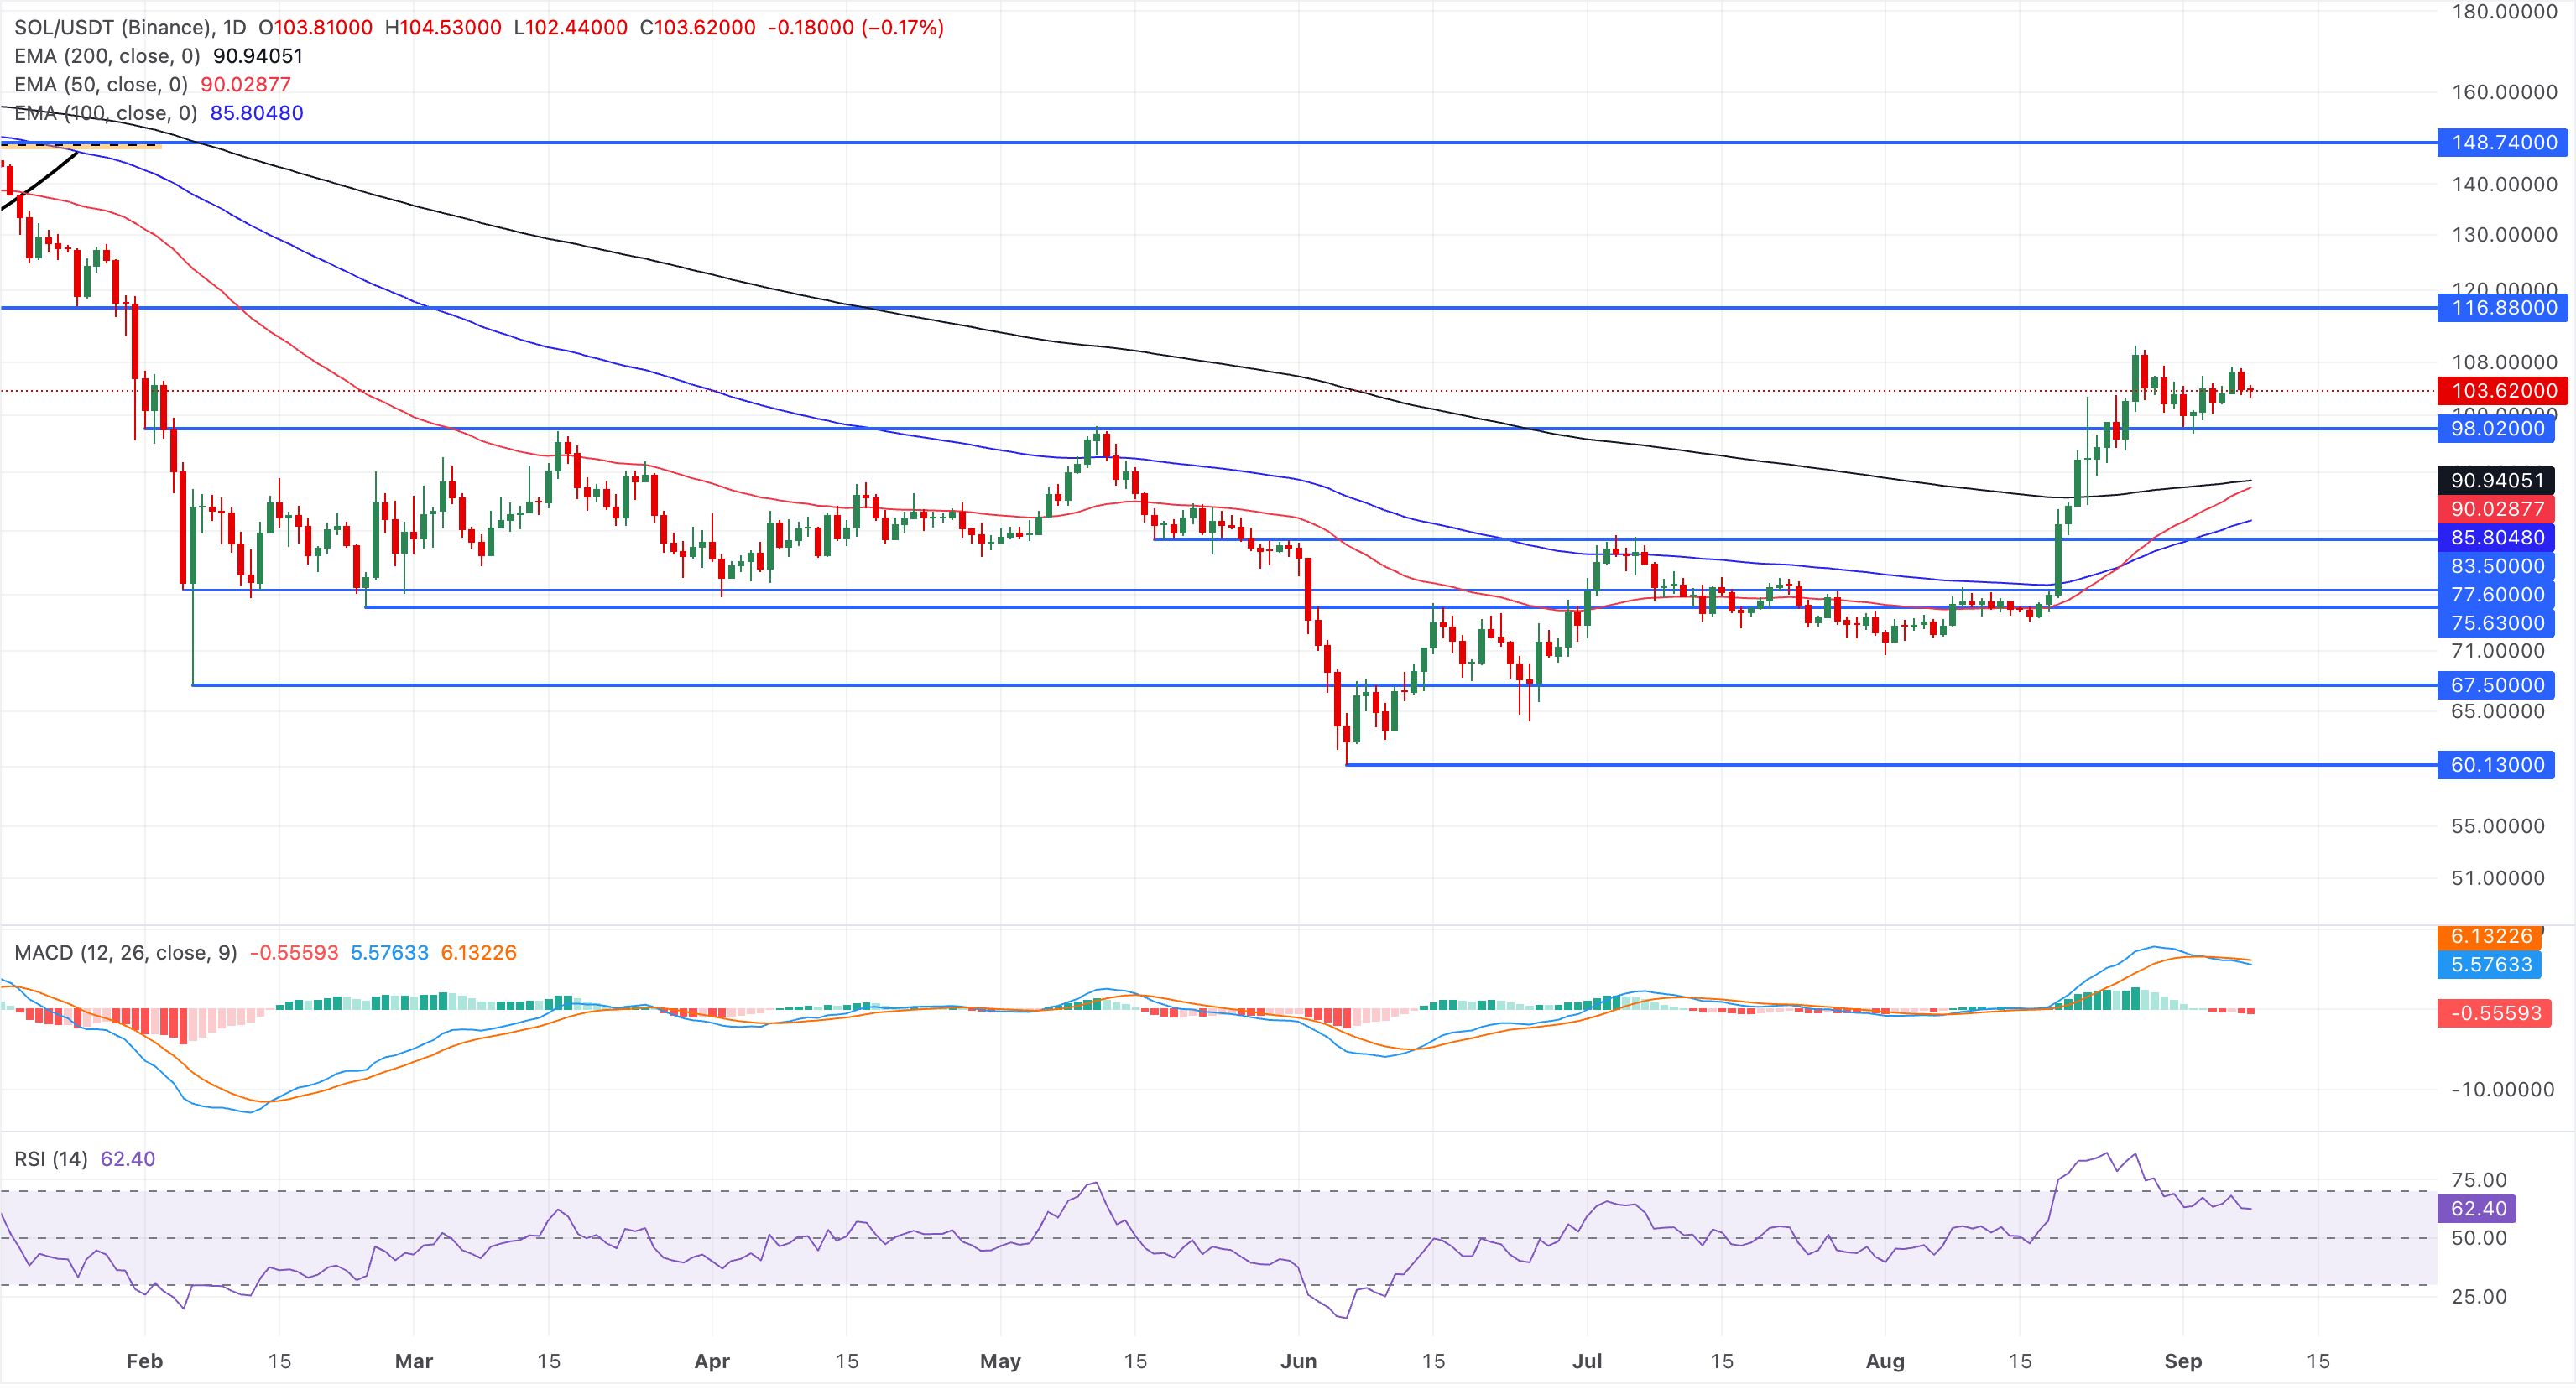
On the downside, initial support is seen around the $100 psychological level, reinforced by the 200-day EMA near $90.94 and the 50-day EMA near $90.03.
(The technical analysis of this story was written with the help of an AI tool. Know more.)
Recommended Articles










Comments (0)
Click the $ button, enter the symbol, and select to link a stock, ETF, or other ticker.