


Ethereum shows mild weakness as derivatives interest, US sentiment weakens



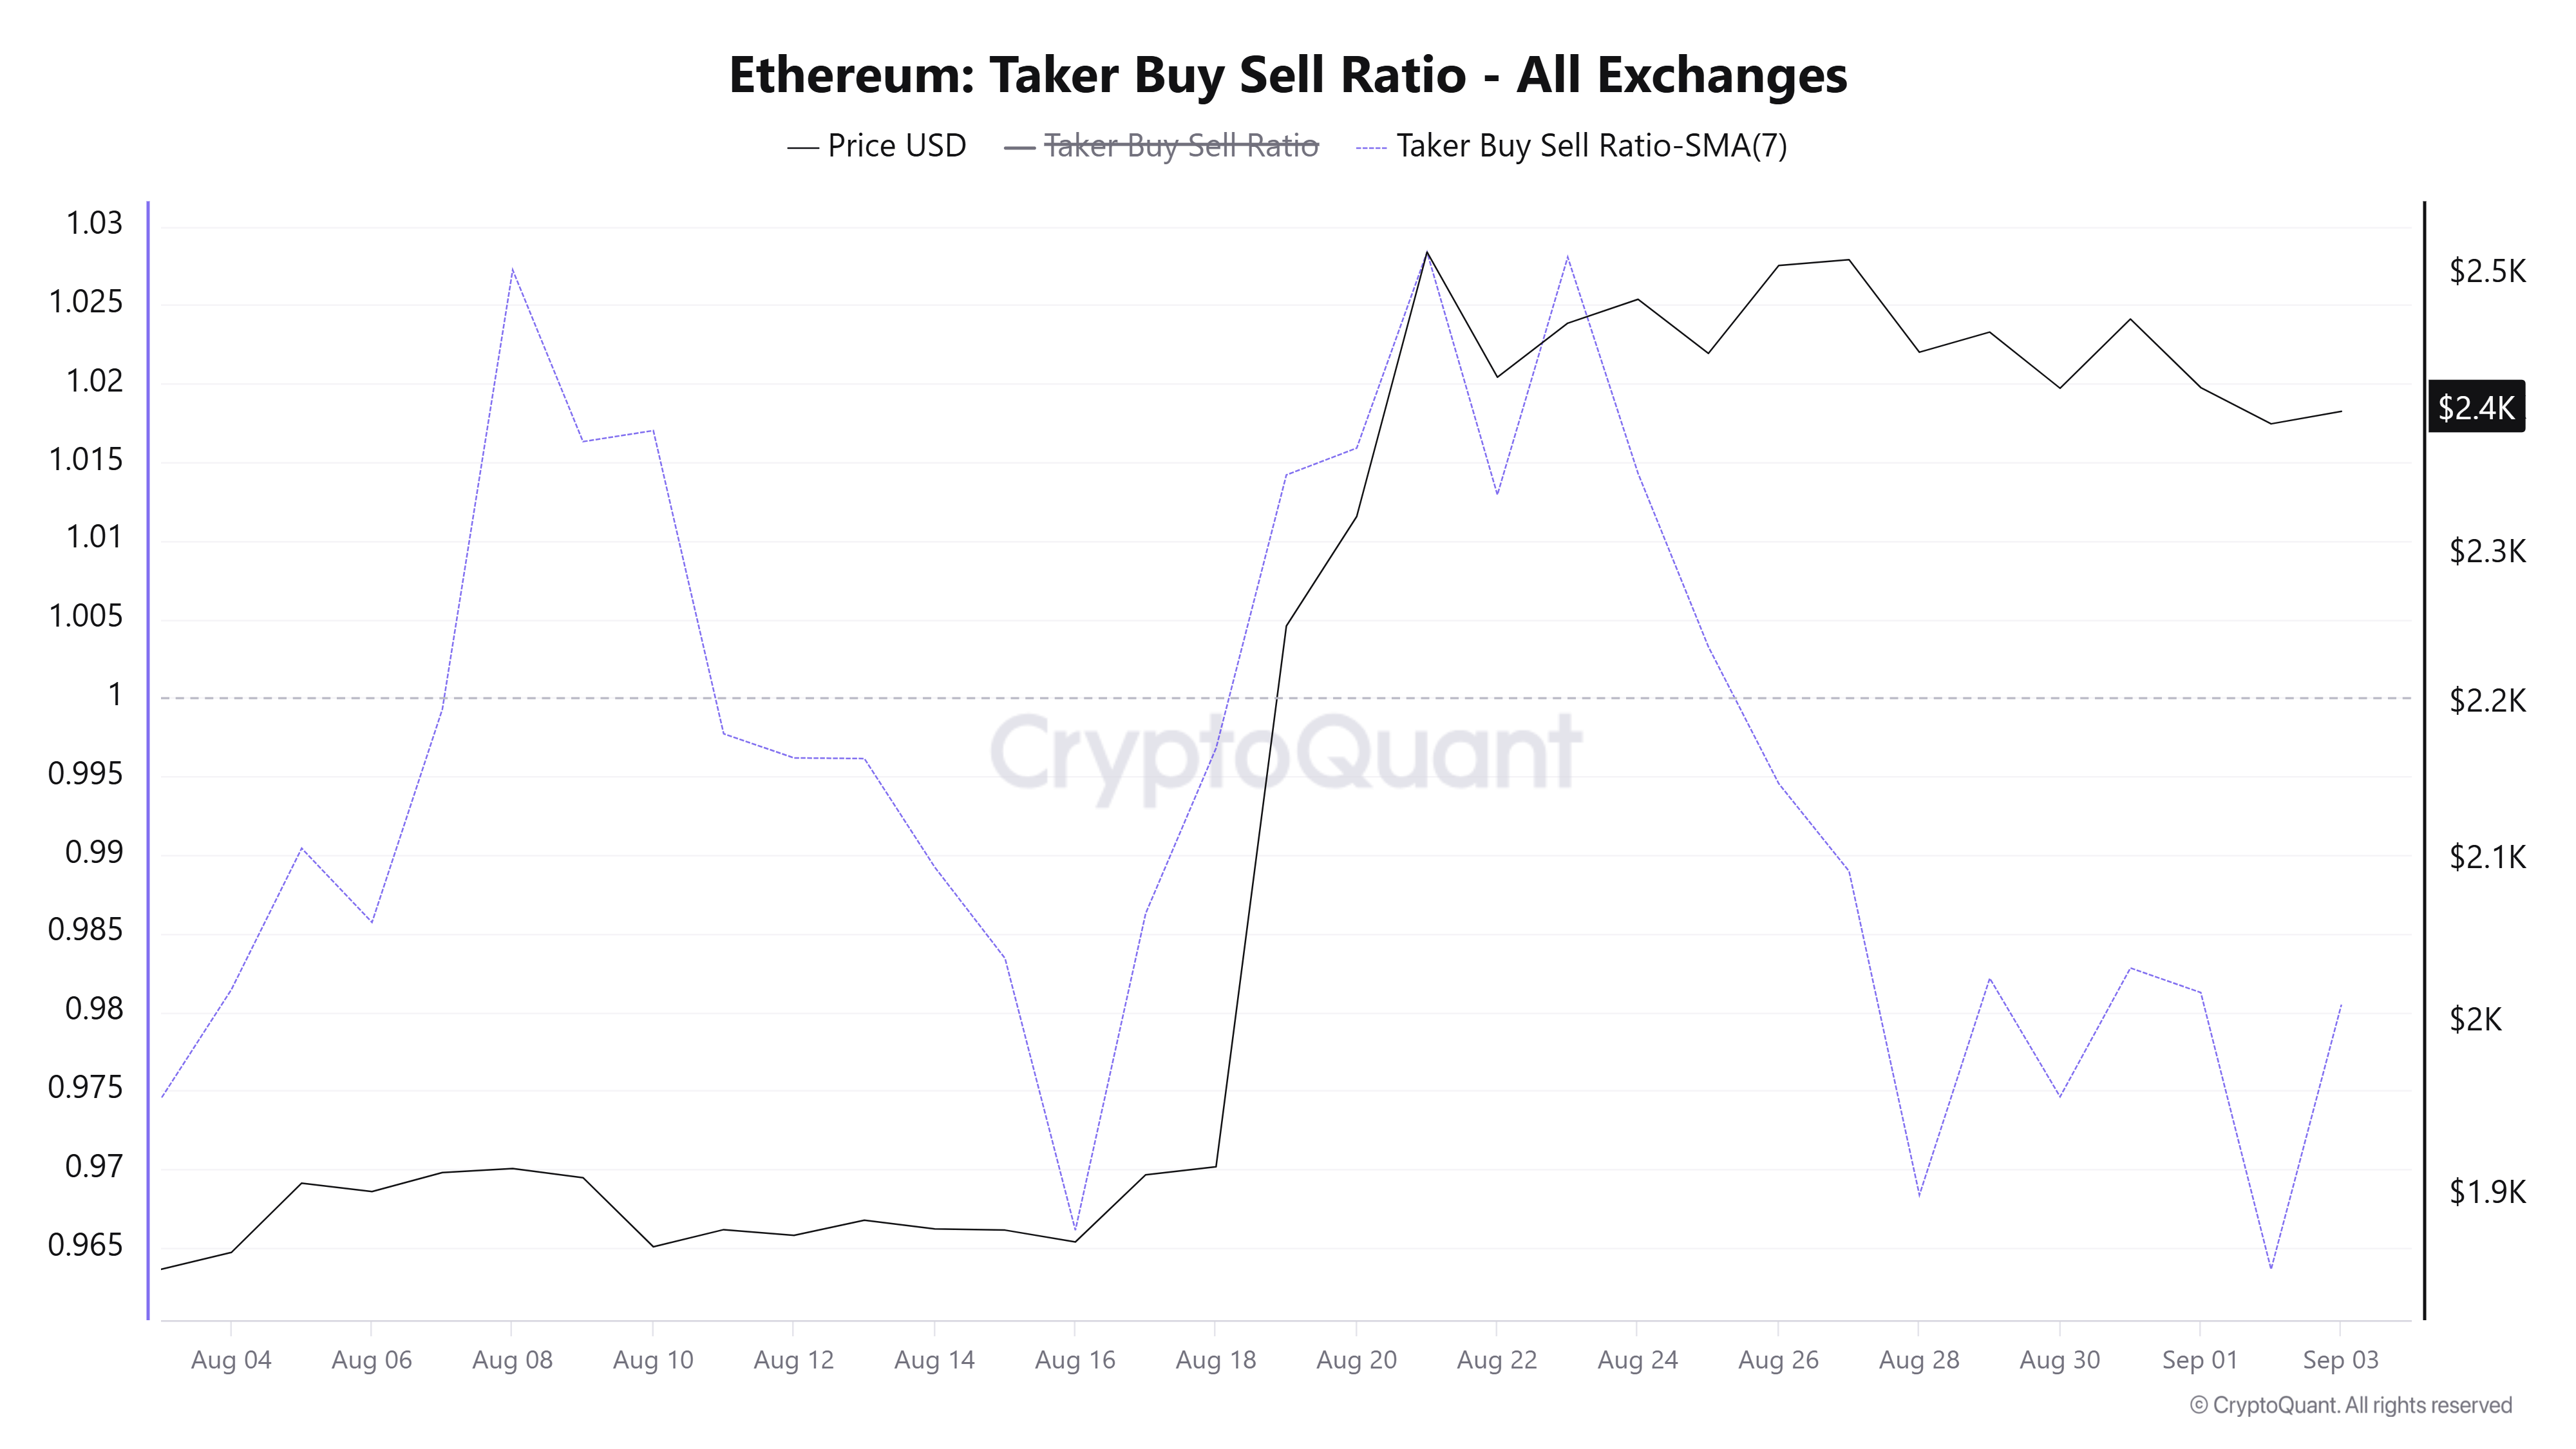
- Derivatives interest in ETH has flipped toward a selling bias following a drop in the Taker Buy Sell Ratio.
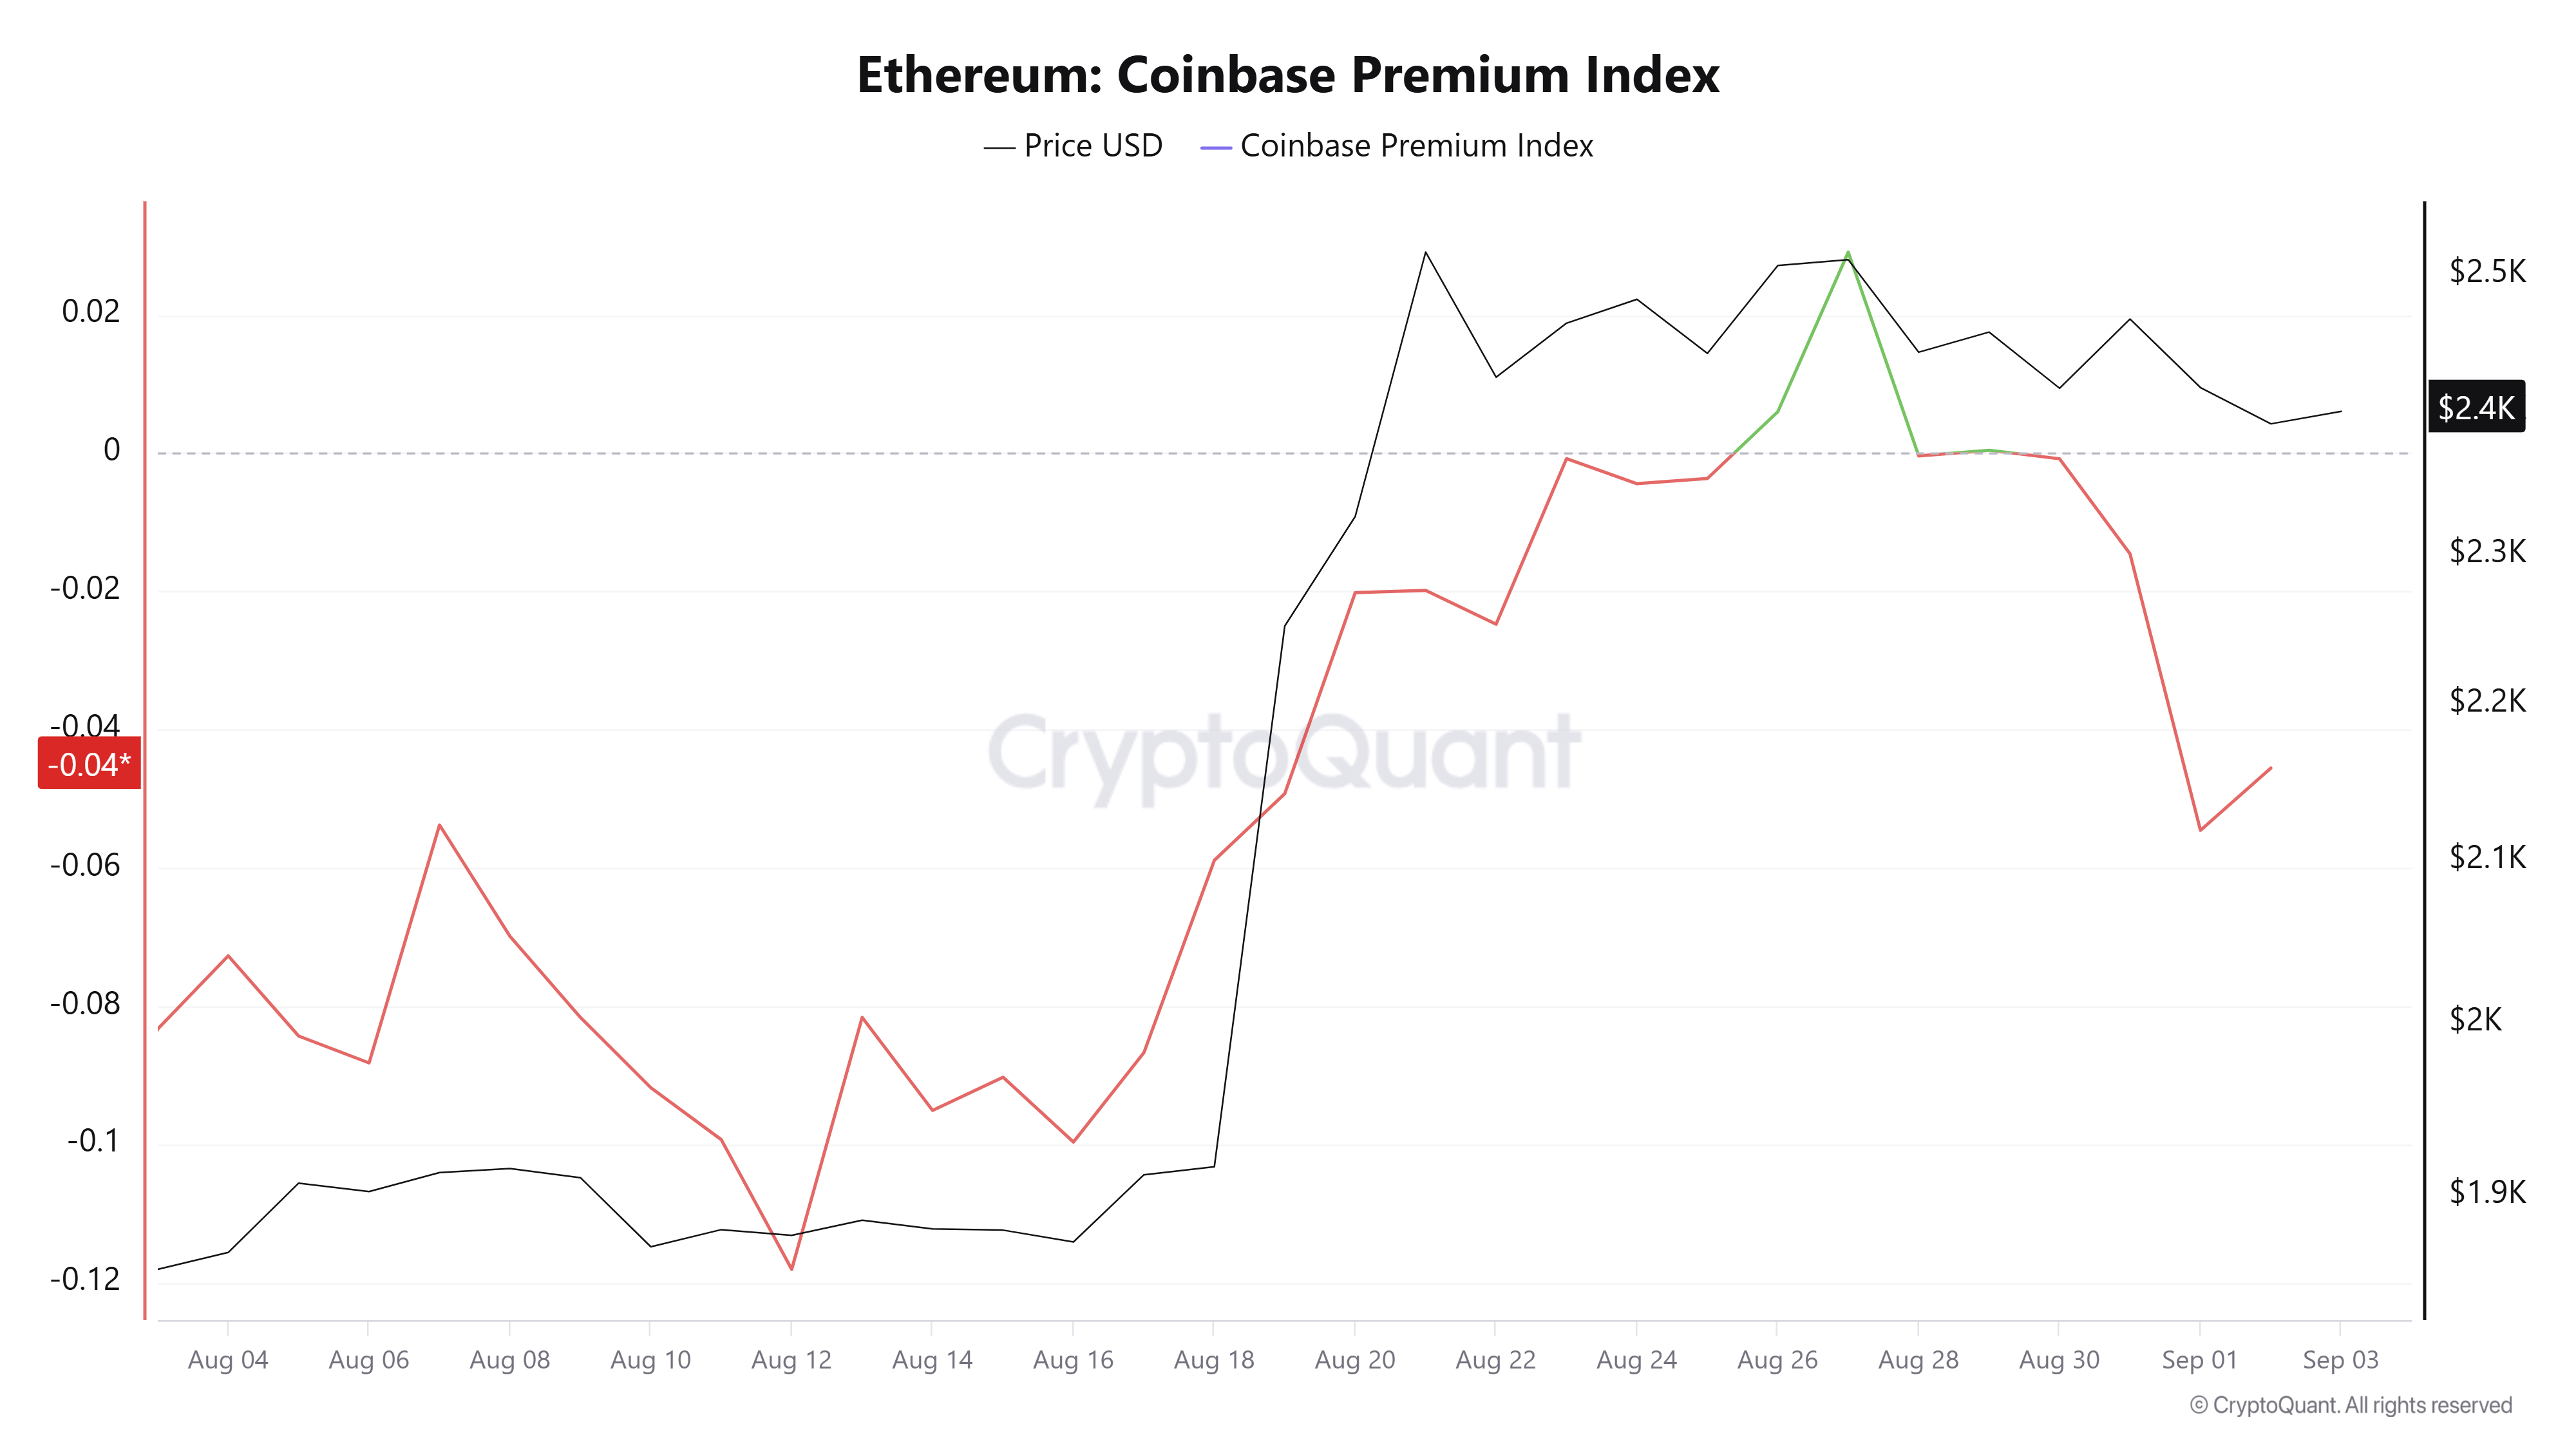
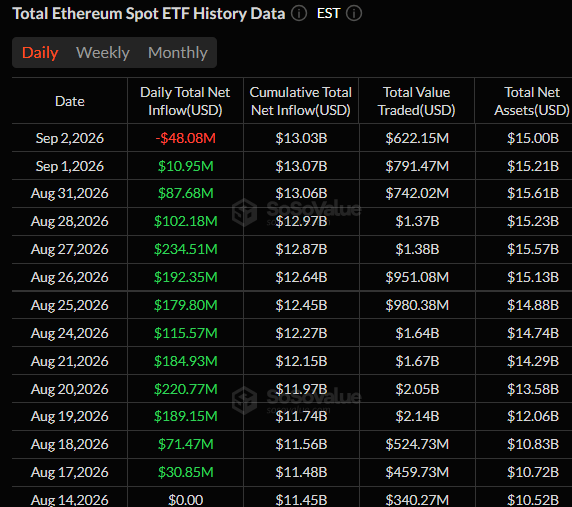
- US sentiment has declined, with the Coinbase Premium Index flipping negative and spot ETH ETFs breaking their 12-day inflow streak.
- ETH eyes the 20-day EMA support after falling below $2,431.
Ethereum (ETH) eases toward $2,400 on Thursday as derivatives interest and US sentiment tilts toward the downside.
The 7-day moving average of the Taker Buy Sell Ratio has been trending lower in negative territory over the past week. The ratio measures the proportion of immediate buying volume against selling volume in perpetual futures. Negative values indicate dominant selling pressure, and vice versa for positive values.
A similar trend is evident in Net Taker Volume, which measures the difference between buying and selling volume in perpetual futures trades executed with market orders. The metric remains positive but has eased significantly over the past week.
While derivatives interest is tilting toward the downside, US sentiment is also weakening. Following ETH's recent rise, the Coinbase Premium Index, a measure of US sentiment, turned positive last week for the first time since May. However, it quickly returned to negative territory this week, suggesting buying pressure from US investors has contracted compared with previous weeks.
Similarly, US spot ETH Exchange-Traded Funds (ETFs) recorded $48 million in net outflows on Wednesday, breaking a 12-day positive streak, according to SoSoValue data.
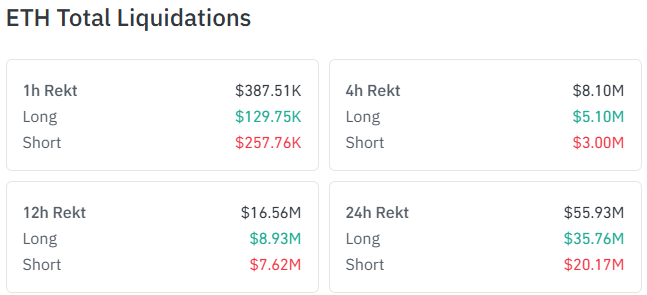
Moreover, Ethereum has seen $55.9 million in liquidations over the past 24 hours, led by $35.7 million in long liquidations, per CoinGlass data.
Ethereum technical outlook: ETH eyes 20-day EMA after declining below $2,431 support
On the daily chart, ETH maintains a bullish bias as price holds above the 20-, 50-, 100- and 200-day Exponential Moving Averages (EMAs), which underpin the advance.
The 14-day Relative Strength Index (RSI) at 61 stays in bullish territory without being overbought, while the Stochastic Oscillator (Stoch) has cooled toward 31, hinting at a pause in upside momentum rather than a full reversal as the top altcoin consolidates just beneath nearby resistance.
On the topside, initial resistance is seen at the previous support at the horizontal barrier around $2,431, followed by higher caps at $2,656 and $2,795.
On the downside, immediate support is provided by the 20-day EMA around $2,323, with additional layers of demand at $2,172 and the 50-day EMA at $2,136. Below these, the 100-day EMA at $2,059 and the 200-day EMA at $2,169, together with the horizontal level at $1,961, form a broader structural floor.
(The technical analysis of this story was written with the help of an AI tool. Know more.)
Recommended Articles








Comments (0)
Click the $ button, enter the symbol, and select to link a stock, ETF, or other ticker.