


Top Altcoins Price Prediction: Ripple, Cardano, Solana – Bulls defend key support levels



- Ripple edges higher on Thursday, retesting the 200-day EMA at $1.38.
- Cardano is up nearly 2% on Thursday, extending its mild 2% rebound from the 50-day EMA at $0.1924 the previous day.
- Solana hovers around $100, holding above its $98.02 horizontal support level.
Ripple (XRP), Cardano (ADA), and Solana (SOL) show mild gains on Thursday, holding at crucial support levels amid easing bullish momentum. The technical outlook for XRP, ADA, and SOL indicates downside risk as the US-Iran war weighs on the broader crypto market.
Ripple pulls back below 200-day EMA
Ripple trades around $1.3685 on Thursday, holding a bullish near-term bias as price advances above the 50-day and 100-day Exponential Moving Averages (EMAs) at $1.2227 and $1.2191, respectively.
Despite this constructive positioning, the 200-day EMA at $1.3827 now acts as the overhead barrier. A confirmed breakout above this level could see XRP extend its recovery toward the August 23 high at $1.5507.
The Moving Average Convergence Divergence (MACD) has moved below its signal line, with a slightly expanding negative histogram, suggesting that upside momentum is softening as the Relative Strength Index (RSI) near 60 approaches the neutral zone from overbought territory.
On the downside, initial demand is seen around the clustered dynamic supports provided by the 50-day and 100-day EMAs near $1.2227 and $1.2191, with deeper structural support traced back toward the prior breakout area around $1.0573.
Cardano rebounds from key support cluster
Cardano is up nearly 2% on Thursday, advancing its 2% rise from the previous day. The mild recovery suggests a constructive near-term bullish bias, with price trading above both the 50-day EMA at $0.1925 and the 100-day EMA at $0.1975 while tracking an upward-sloping support trendline around $0.1838.
However, the broader recovery is still capped by the 200-day EMA at $0.2531 overhead, reinforced by an ascending trendline. Cardano must clear above this zone for a sustained recovery toward the February 2 high at $0.2991.
The MACD declines below its signal line and remains marginally above zero, suggesting that upside momentum is waning, while the RSI, at 54, drops from the overbought zone into neutral territory.
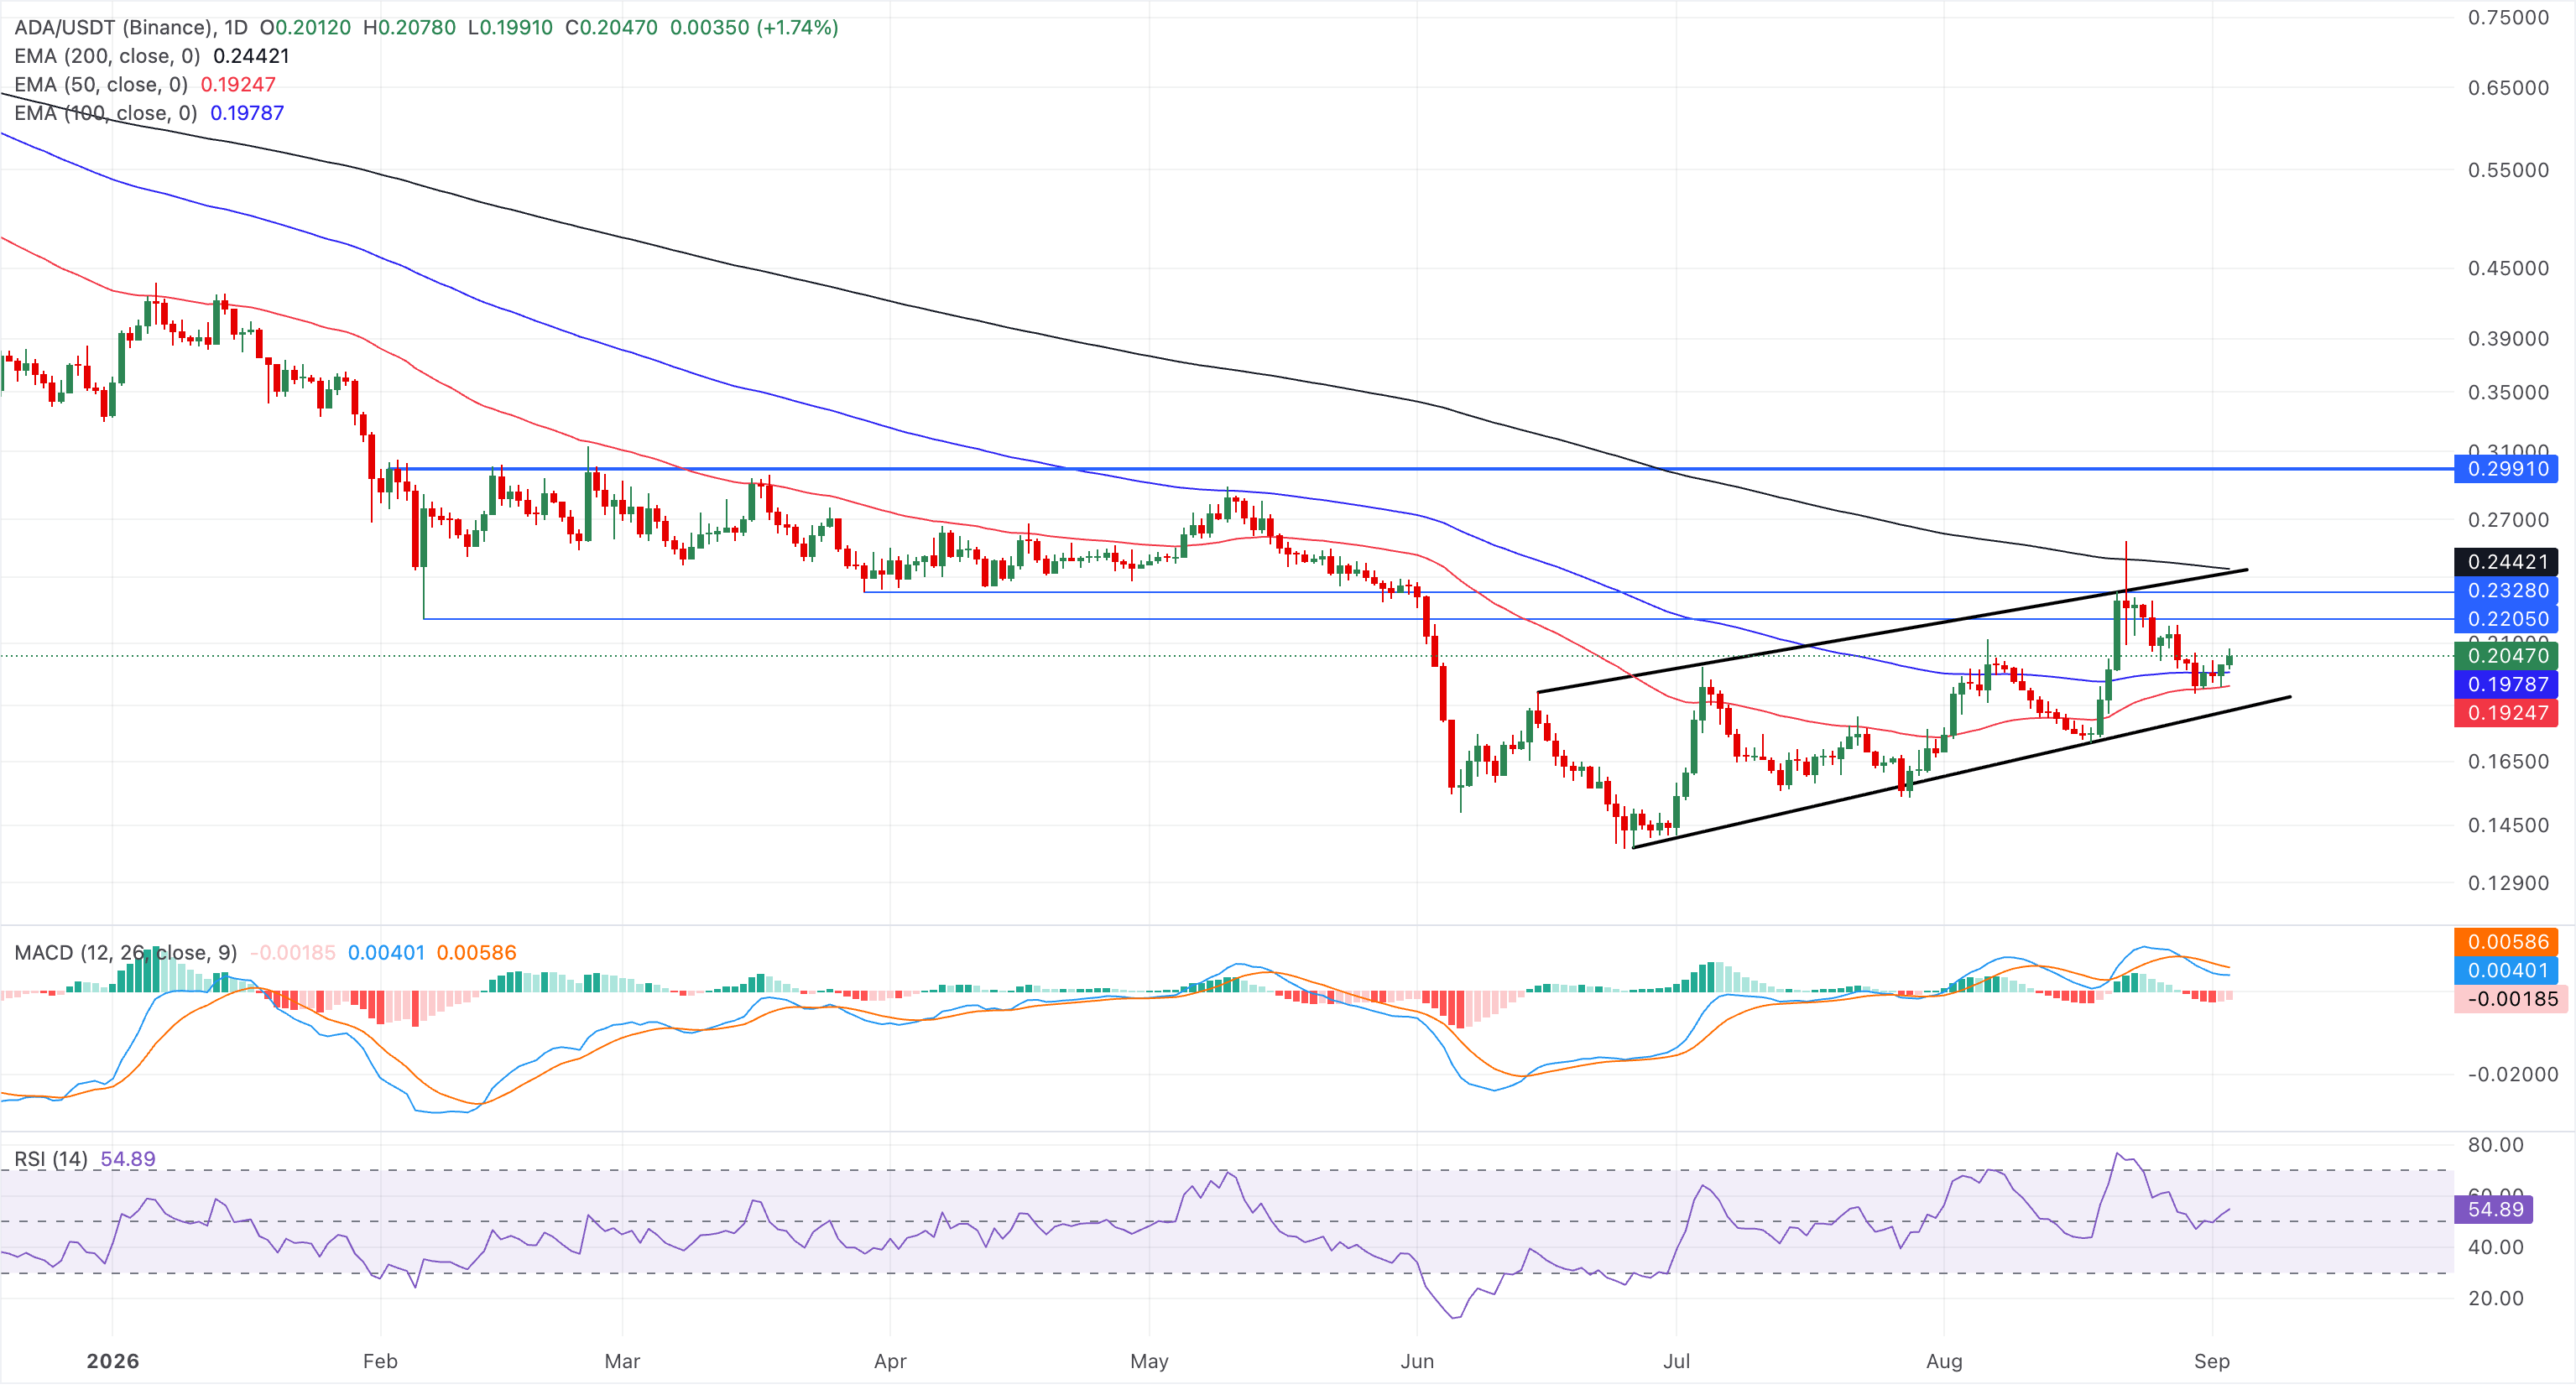
Immediate support is seen at the recent $0.2051 area, with stronger demand clustered around the 100-day EMA at $0.1975 and the 50-day EMA at $0.1925.
Solana is back at $100
Solana trades around $100 at press time on Thursday, maintaining a bullish near-term bias as price holds above the 50-, 100- and 200-day EMAs clustered between roughly $83.85 and $93.58, which collectively underpin the broader uptrend.
The RSI at 63 is declining from overbought territory, indicating easing bullish momentum, while the MACD has slipped marginally below its signal line, hinting at waning upside momentum.
The next notable structural barrier is the horizontal resistance line at $116.88, marked by the December 18 low, which would come into focus only if buyers extend the ongoing advance.
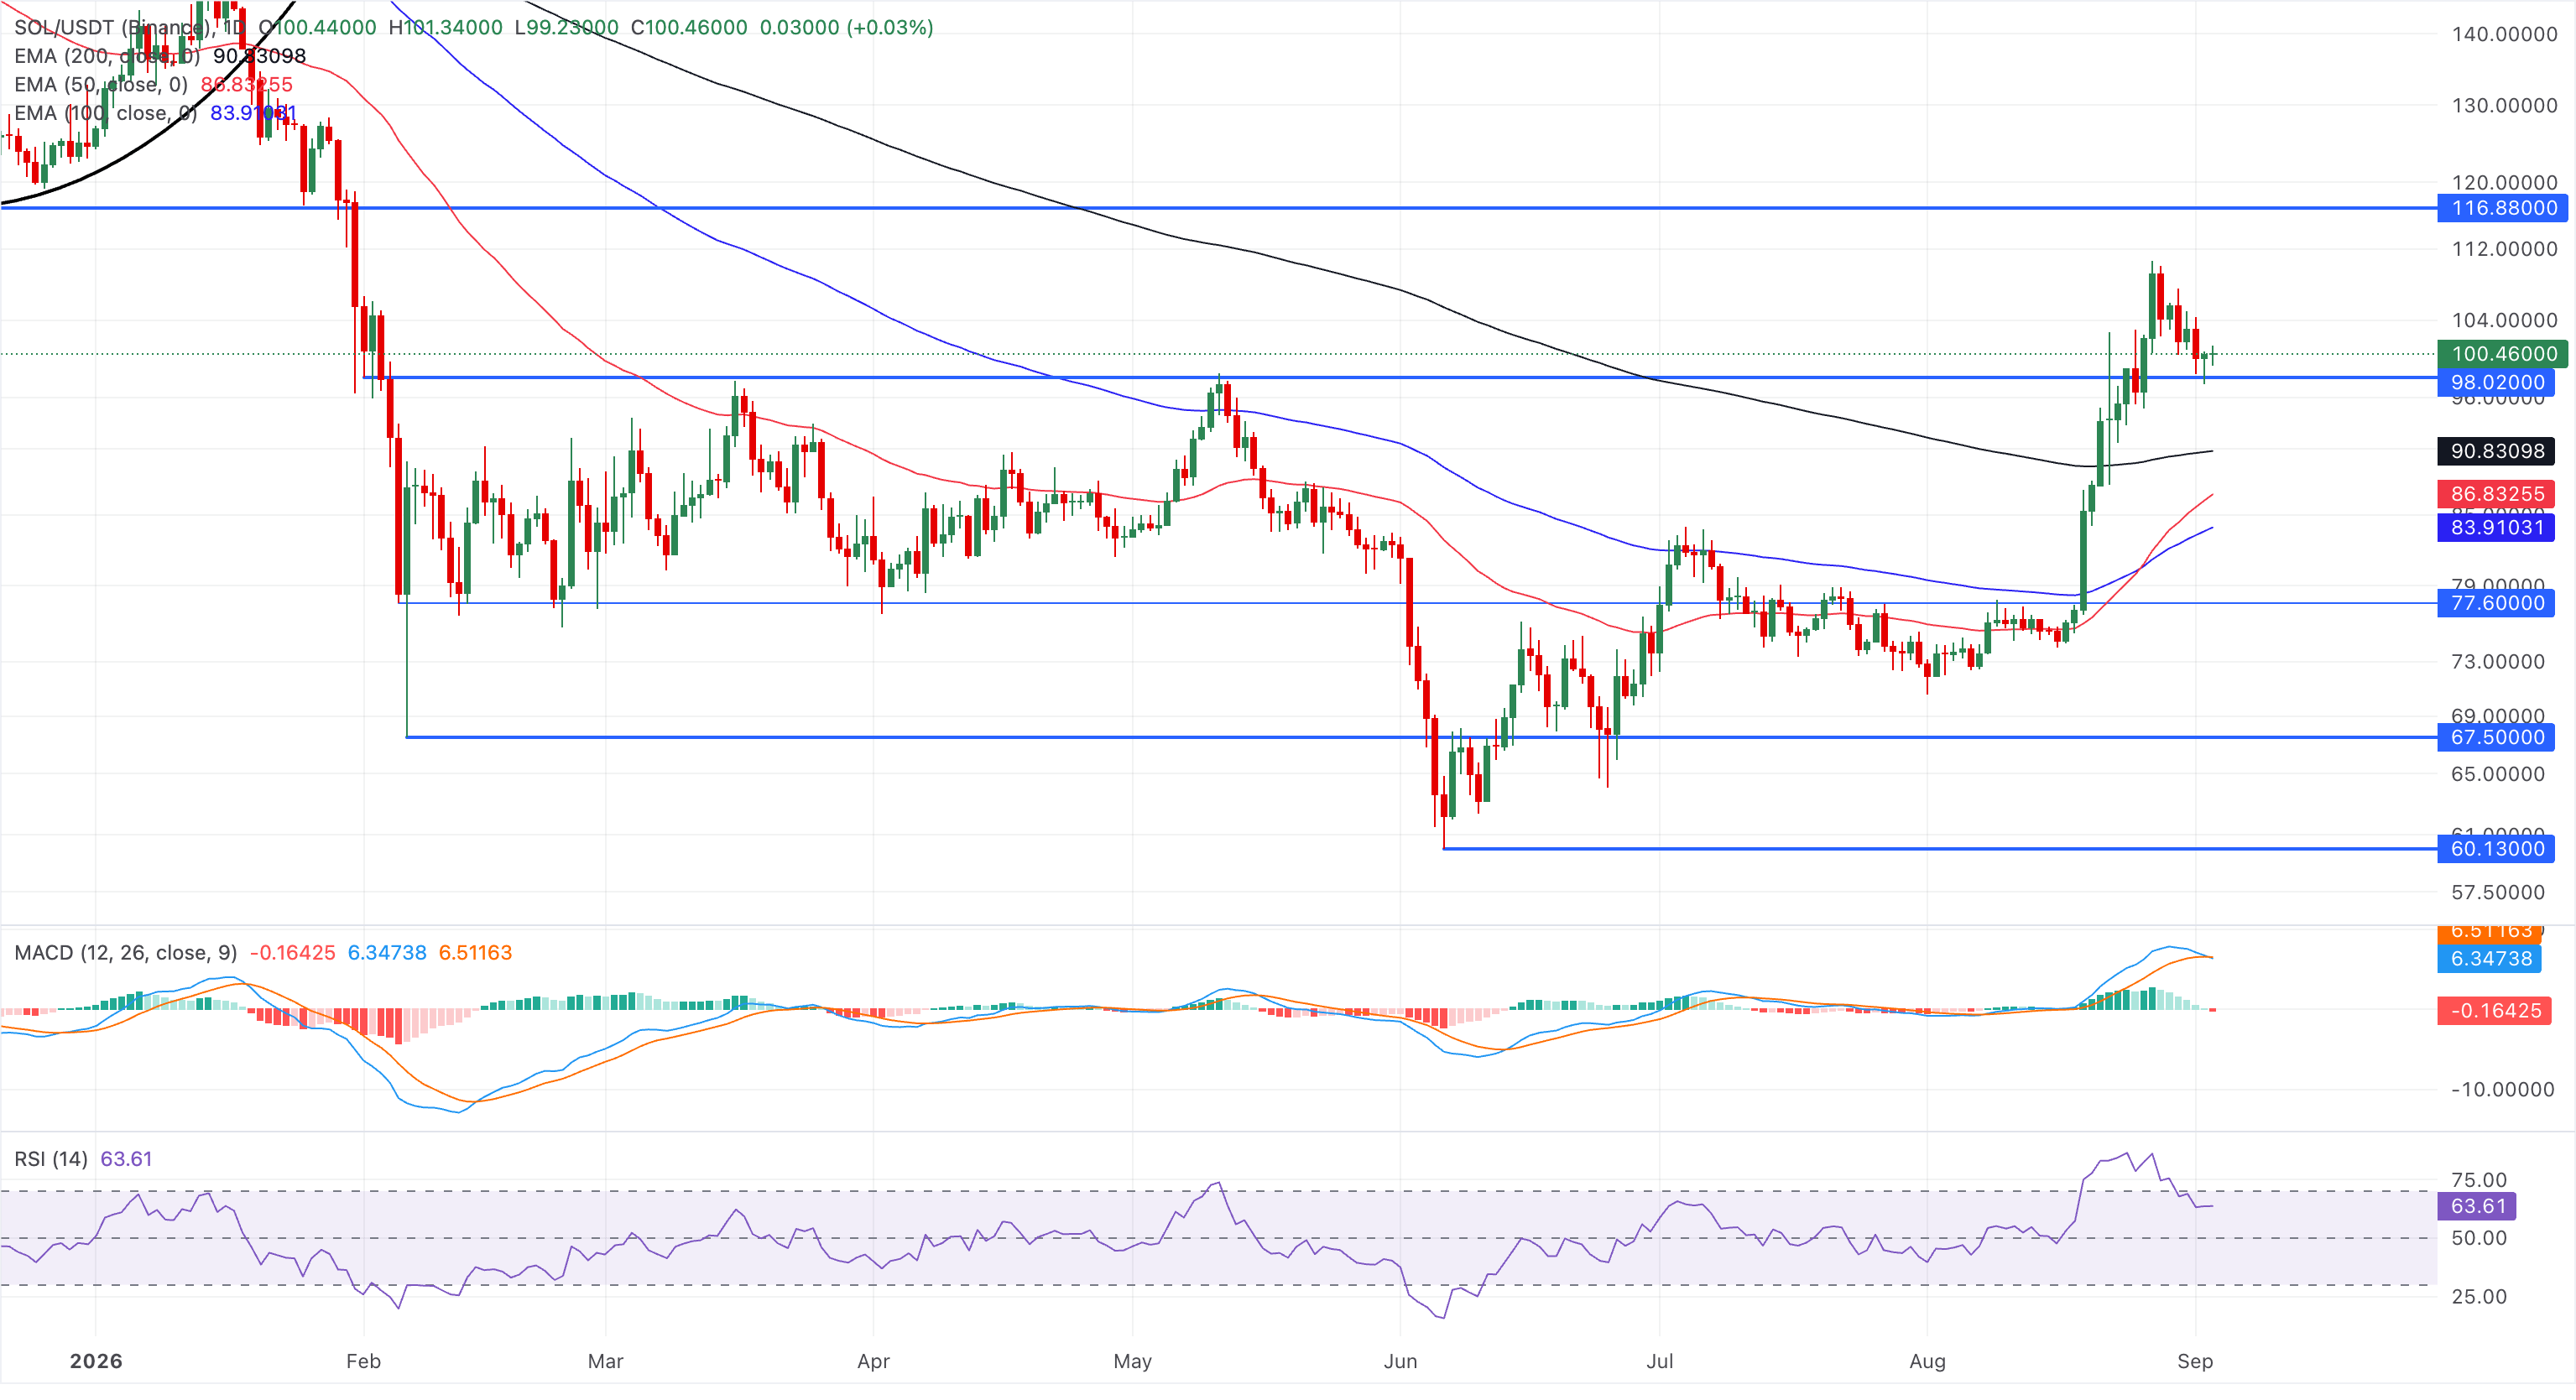
On the downside, immediate support is at the current price level near the $100 psychological threshold, reinforced by the February 1 low at $98.02, followed by the 200-day EMA around $93.58.
(The technical analysis of this story was written with the help of an AI tool. Know more.)
Recommended Articles









Comments (0)
Click the $ button, enter the symbol, and select to link a stock, ETF, or other ticker.