


Ripple and Stellar outlook: XRP defends key support, XLM awaits breakout as derivatives strengthen



- XRP finds support around the 200-day EMA at $1.350, suggesting a possible recovery ahead.
- XLM holds below a dense band of EMA resistance, keeping the near-term bias bearish.
- Improving derivatives metrics for both XRP and XLM point to a potential rebound ahead.
Ripple (XRP) and Stellar (XLM) show divergent technical outlooks as traders assess whether the recent weakness could give way to a recovery. XRP is finding support and defining a key support zone, while XLM slips below a cluster of Exponential Moving Averages (EMAs). However, improving derivatives metrics for both tokens suggest market positioning could be shifting toward a potential short-term rebound.
Derivatives metrics support a potential recovery
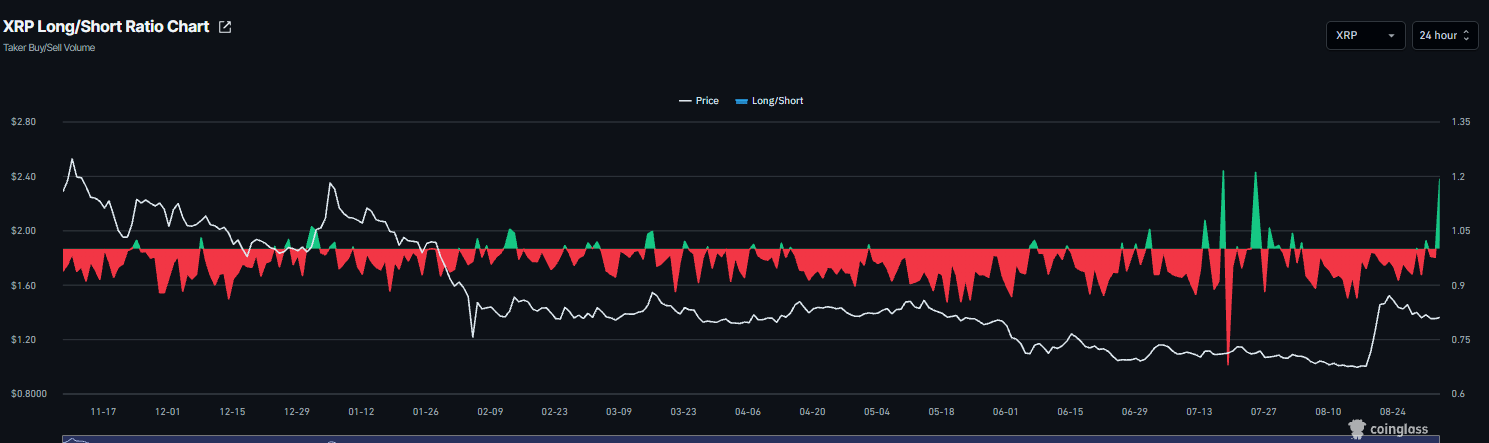
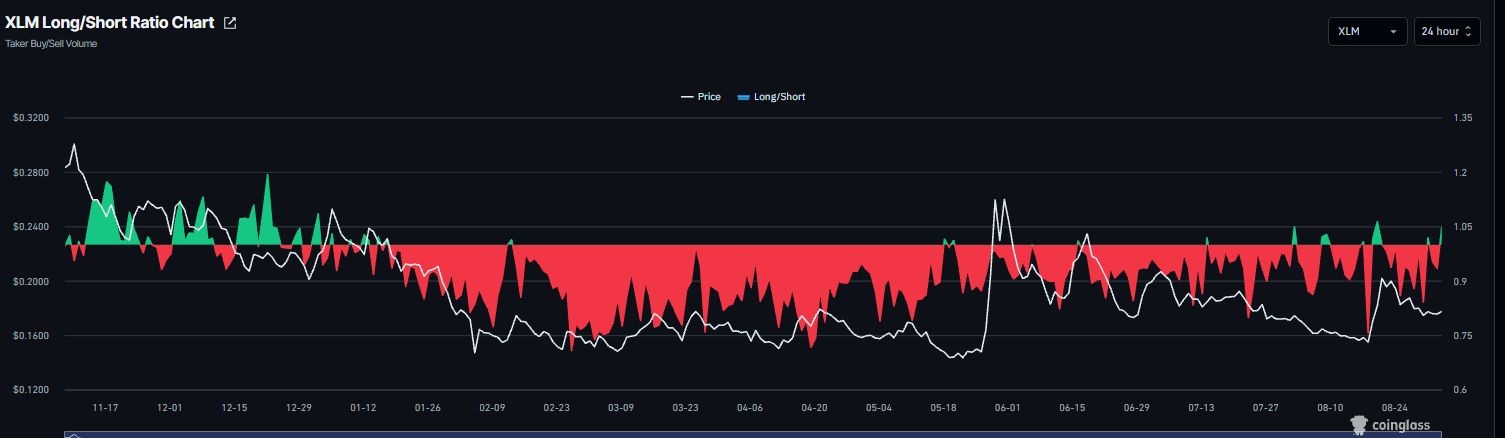
Derivatives data shows a mild bullish tilt among traders. CoinGlass’ long-to-short ratios for XRP and XLM read 1.15 and 1.09, respectively, on Thursday, nearing their highest levels in a month. A ratio above one indicates bullish sentiment, as traders bet asset prices will rise.
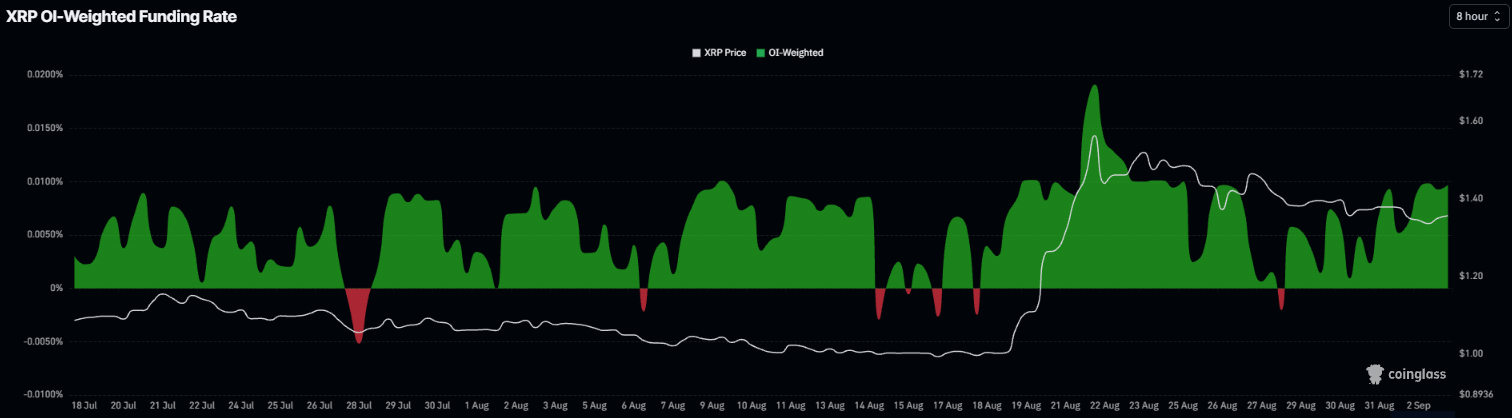
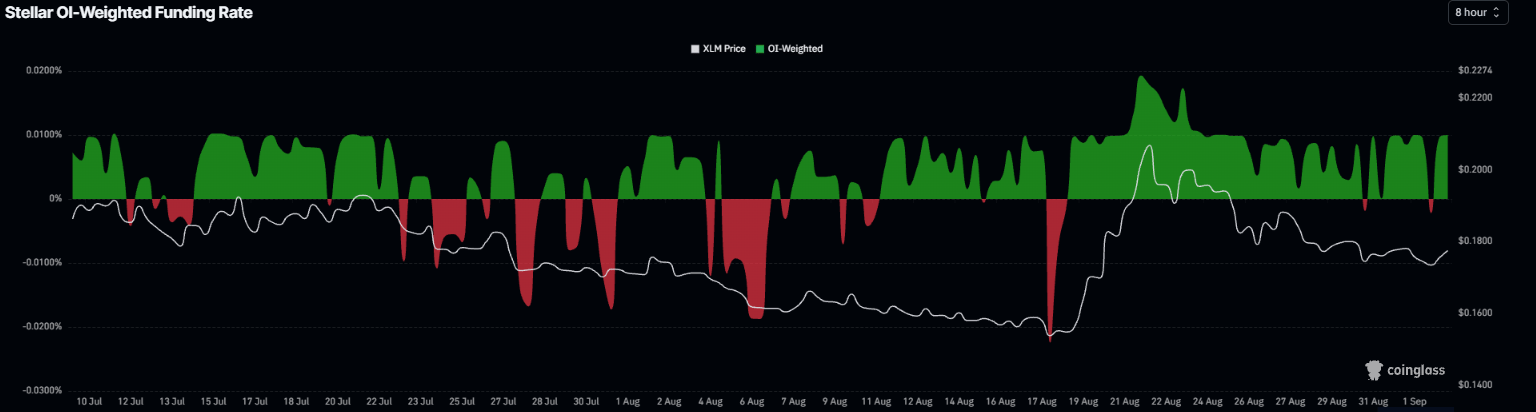
In addition, the XRP funding rate flipped positive on Saturday and read 0.0097% on Thursday, indicating that longs are paying shorts and reflecting a bullish bias. Similarly, the XLM funding rate flipped positive on Wednesday and read 0.0100% on Thursday, reflecting a bullish outlook.
XRP technical outlook: Defends key 200-day EMA
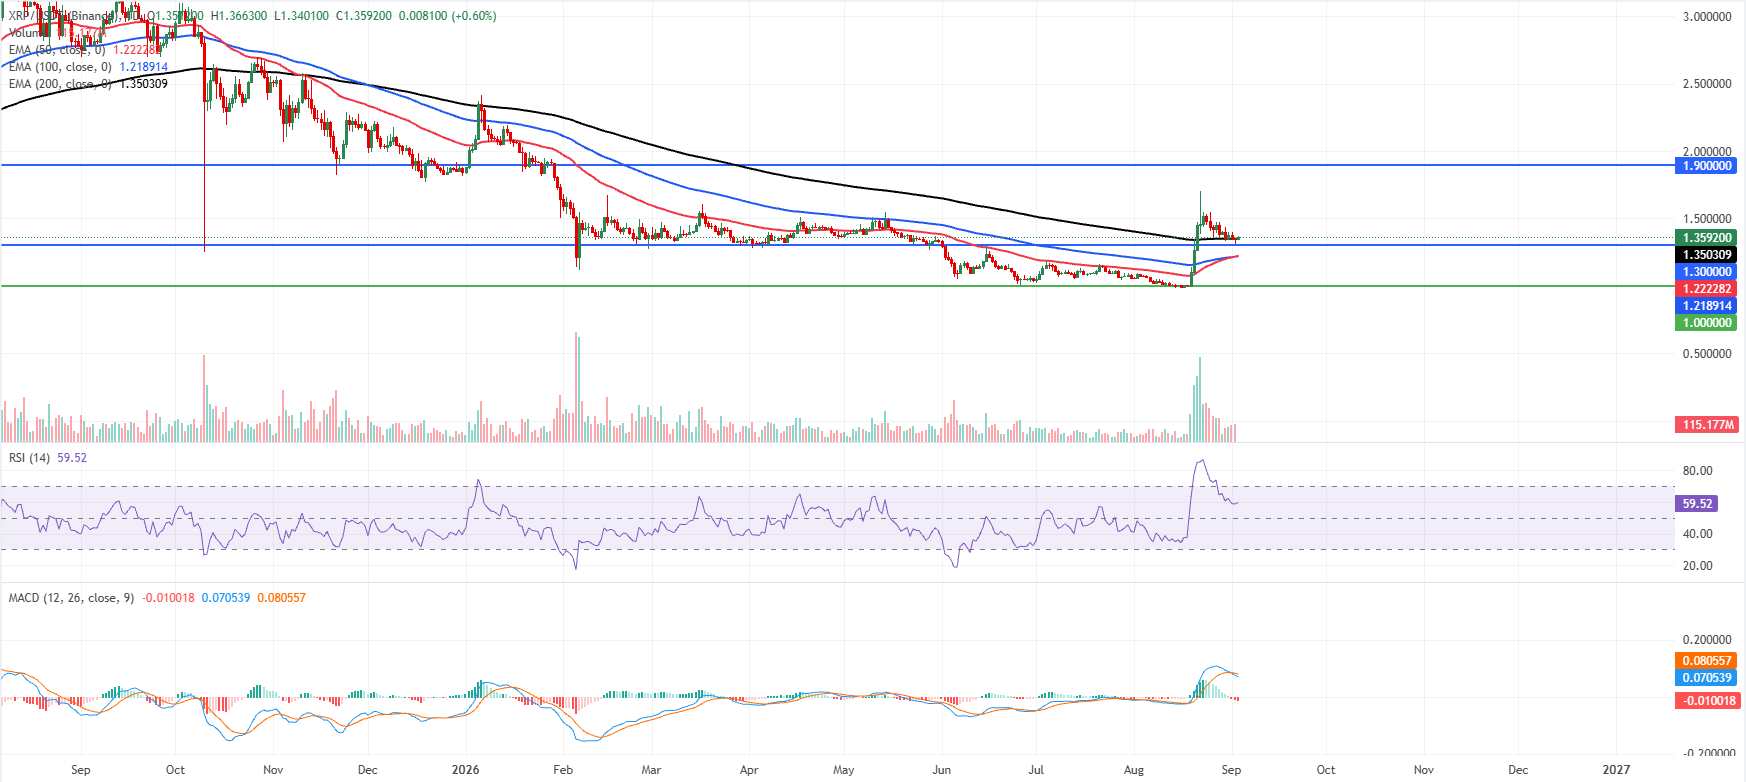
XRP price trades at $1.359 on Thursday, holding above the key EMAs, with the 200-day EMA at $1.350 and the 50-day and 100-day EMAs at $1.222 and $1.218, respectively, which collectively suggest a constructive near-term bias while price consolidates near recent highs.
The Relative Strength Index (RSI) at 59 shows momentum cooling from prior overbought extremes but still leans mildly positive. In contrast, the Moving Average Convergence Divergence (MACD) has slipped into negative territory, hinting at a loss of upside traction rather than a completed bearish reversal as long as price remains supported above the 200-day EMA.
On the downside, immediate support is just below the market at the 200-day EMA around $1.350, with a stronger structural floor at the horizontal level of $1.300 before deeper demand emerges near the clustered 50-day and 100-day EMAs around $1.220 and, farther below, the $1.000 psychological zone.
On the topside, the next notable resistance does not appear until the horizontal barrier at $1.900, suggesting that if buyers can defend the $1.350–$1.300 band, the broader uptrend could resume toward that ceiling once momentum stabilizes.
XLM technical outlook: Slips below key support zone
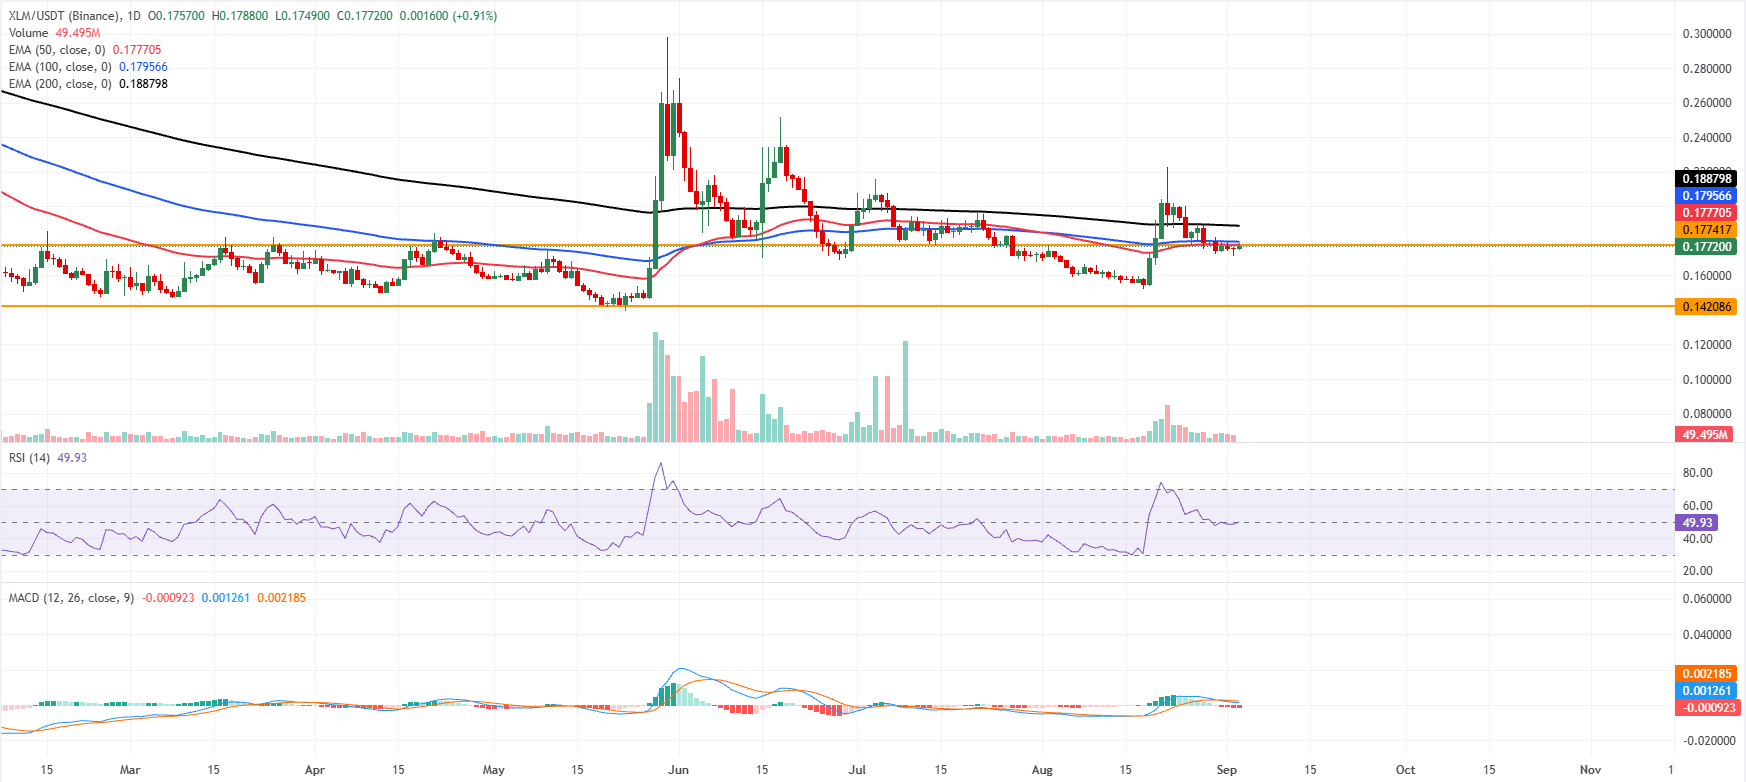
XLM trades at $0.1772 on Thursday, holding below a dense band of EMA resistance that keeps the near-term bias bearish.
XLM price is capped first by a horizontal barrier at $0.1774, closely followed by the 50-day EMA at $0.1777 and the 100-day EMA at $0.1795, while the 200-day EMA sits higher at $0.1887, reinforcing the broader downtrend.
The RSI at 49 sits near neutral, and the MACD has slipped slightly negative, suggesting waning upside momentum after the recent rally and favoring consolidation or a mild pullback while these overhead levels remain intact.
On the topside, immediate resistance sits at $0.1774, with the 50-day EMA at $0.1777 and the 100-day EMA at $0.1795 forming a tight cluster that XLM would need to clear to resume a push toward the 200-day EMA at $0.1887.
On the downside, the next notable support sits at the horizontal level of $0.1420, where buyers could reemerge if selling pressure extends. However, the lack of nearer structural floors leaves the pair vulnerable to sharper downside if current resistance continues to reject advances.
(The technical analysis of this story was written with the help of an AI tool. Know more.)
Recommended Articles








Comments (0)
Click the $ button, enter the symbol, and select to link a stock, ETF, or other ticker.