


Pi Network Price Forecast: PI lacks rebound momentum despite market-wide recovery



- Pi Network edges higher on Tuesday, hovering above $0.0900 as bulls target the $0.1000 psychological barrier.
- The crypto market sustains the risk-on sentiment, projecting upside potential for the PI token.
- The technical outlook for PI remains neutral as momentum lacks upside while price holds above the $0.0853 support level.
Pi Network (PI) edges higher on Tuesday, reclaiming $0.0900 amid rising PI futures Open Interest, suggesting renewed retail confidence. The broader crypto market's risk-on sentiment supports PI token's upside potential, as capital rotation could lift speculation-driven digital assets. The technical outlook for PI remains mixed, as it lacks the decisive momentum to fuel a rebound above $0.1000.
Speculations build amid broader market recovery
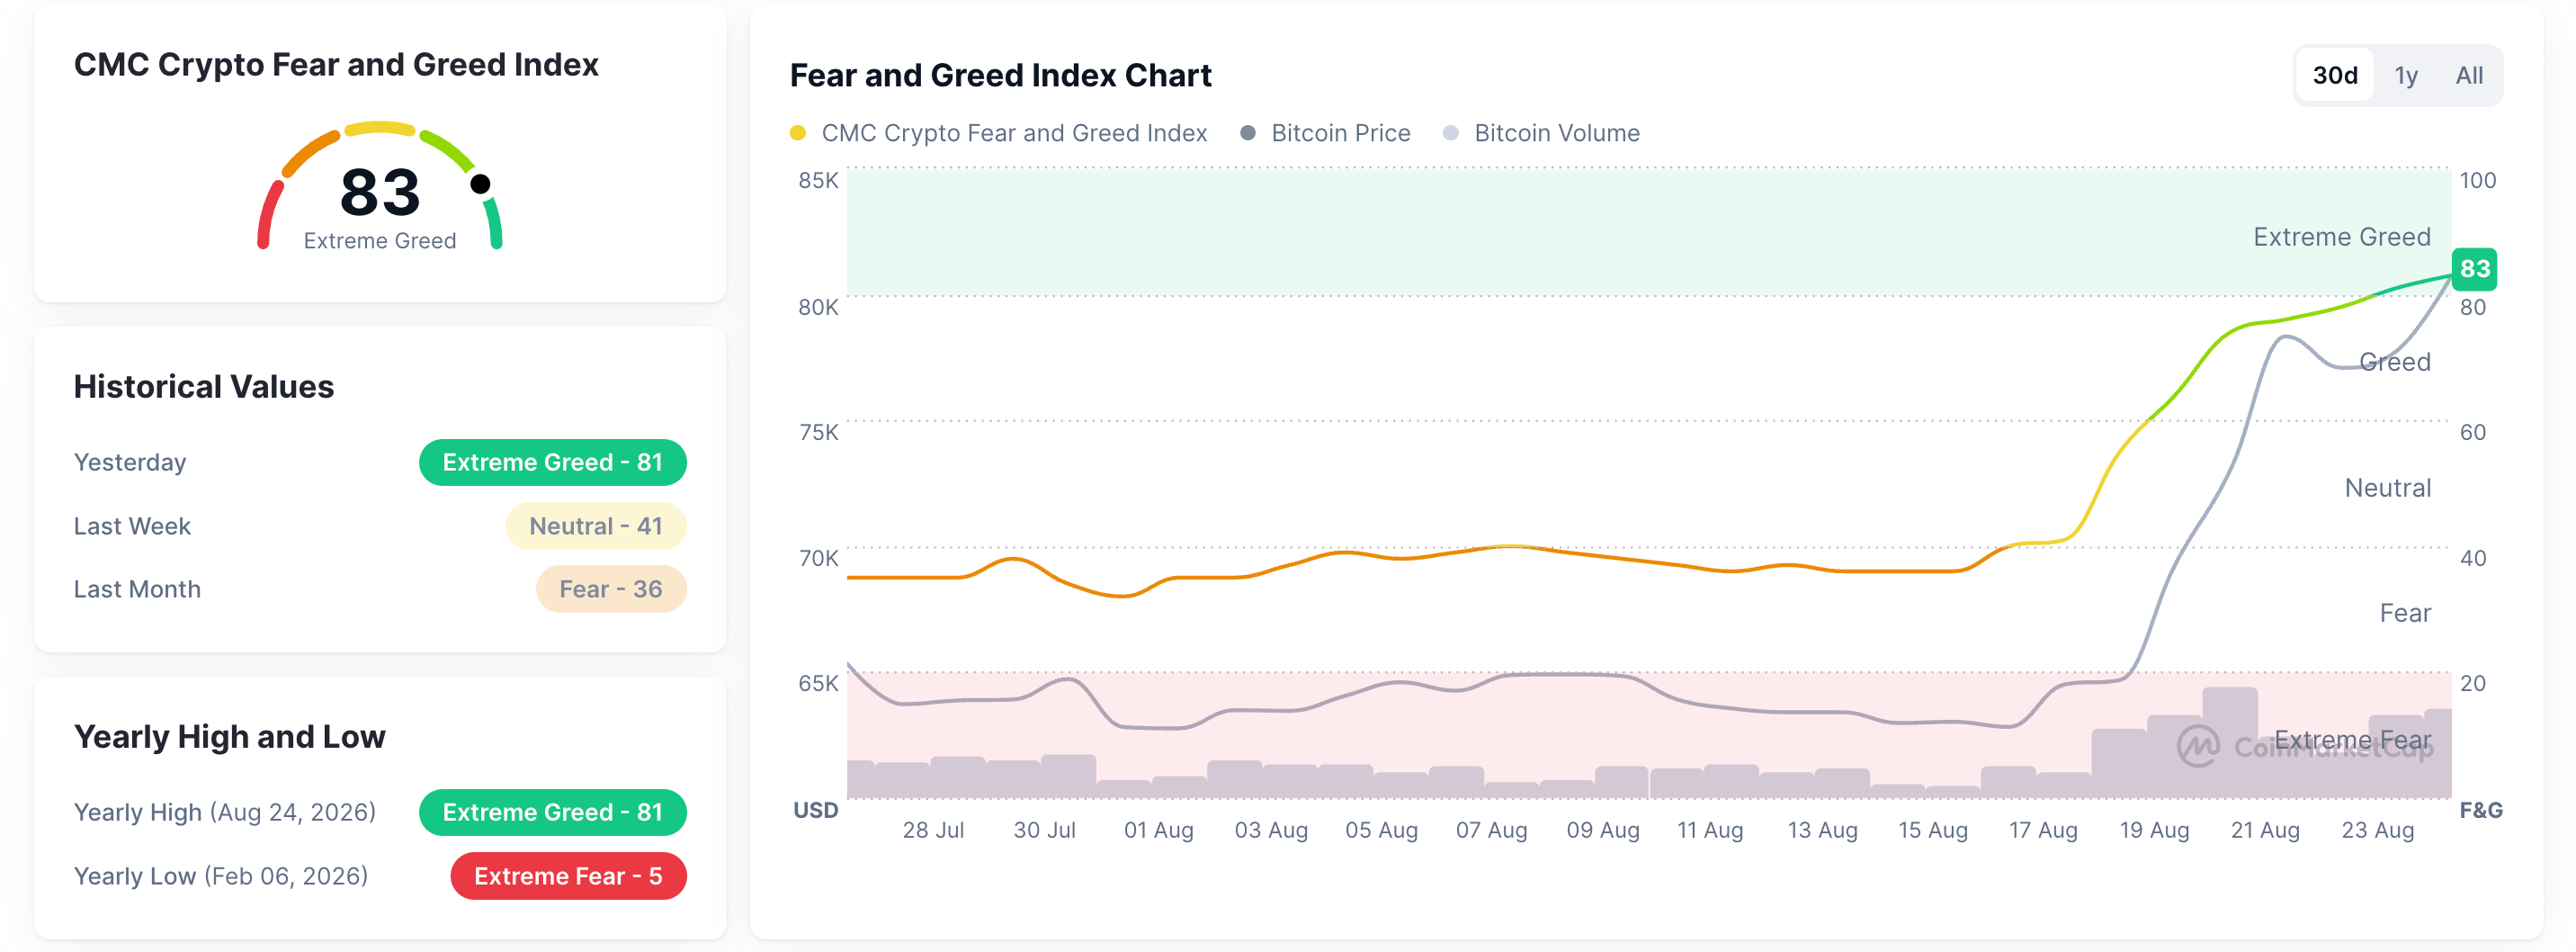
Bitcoin (BTC) rising above $80,000 on Tuesday, driven by US Treasury efforts to lower yields, boosts broader market risk-on sentiment. CoinMarketCap’s Fear and Greed Index at 83 reflects strong demand in the crypto market, which often fuels rallies in low-market-capitalization altcoins like Pi Network.
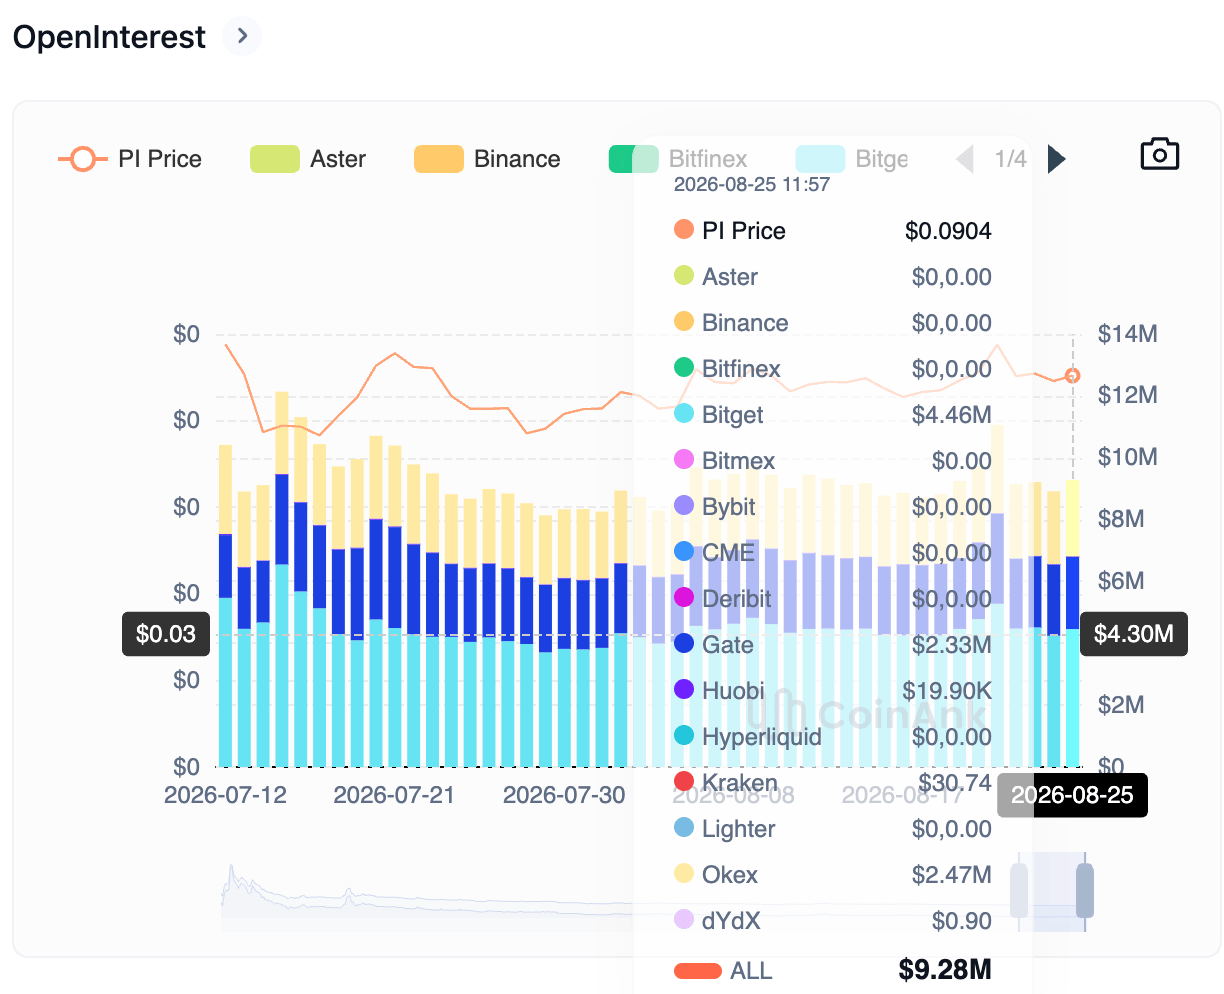
PI futures data point to early signs of rising speculative demand. CoinAnk data shows the PI futures Open Interest (OI) rising to $9.28 million, up from $8.89 million the previous day, suggesting a positional buildup.
Technical outlook: Will Pi Network extend gains above $0.10?
Pi Network holds above $0.0900 at press time on Tuesday, with near-term upside capped below the $0.1000 psychological threshold. From a technical perspective, the PI token consolidates above the 23.6% Fibonacci retracement of the downswing from $0.1341 to $0.0703 at $0.0853.
For a sustained recovery, PI must reclaim the $0.1000 level, reinforced by the 50% retracement at $0.1022. A confirmed breakout above $0.1022 could target the 78.6% Fibonacci retracement at $0.1204.
The Moving Average Convergence Divergence (MACD) maintains a slight positive slope, reaching the zero line on the daily chart, suggesting mild upside momentum. At the same time, the Relative Strength Index (RSI) hovers just above 50, reaffirming the mild bullish momentum.
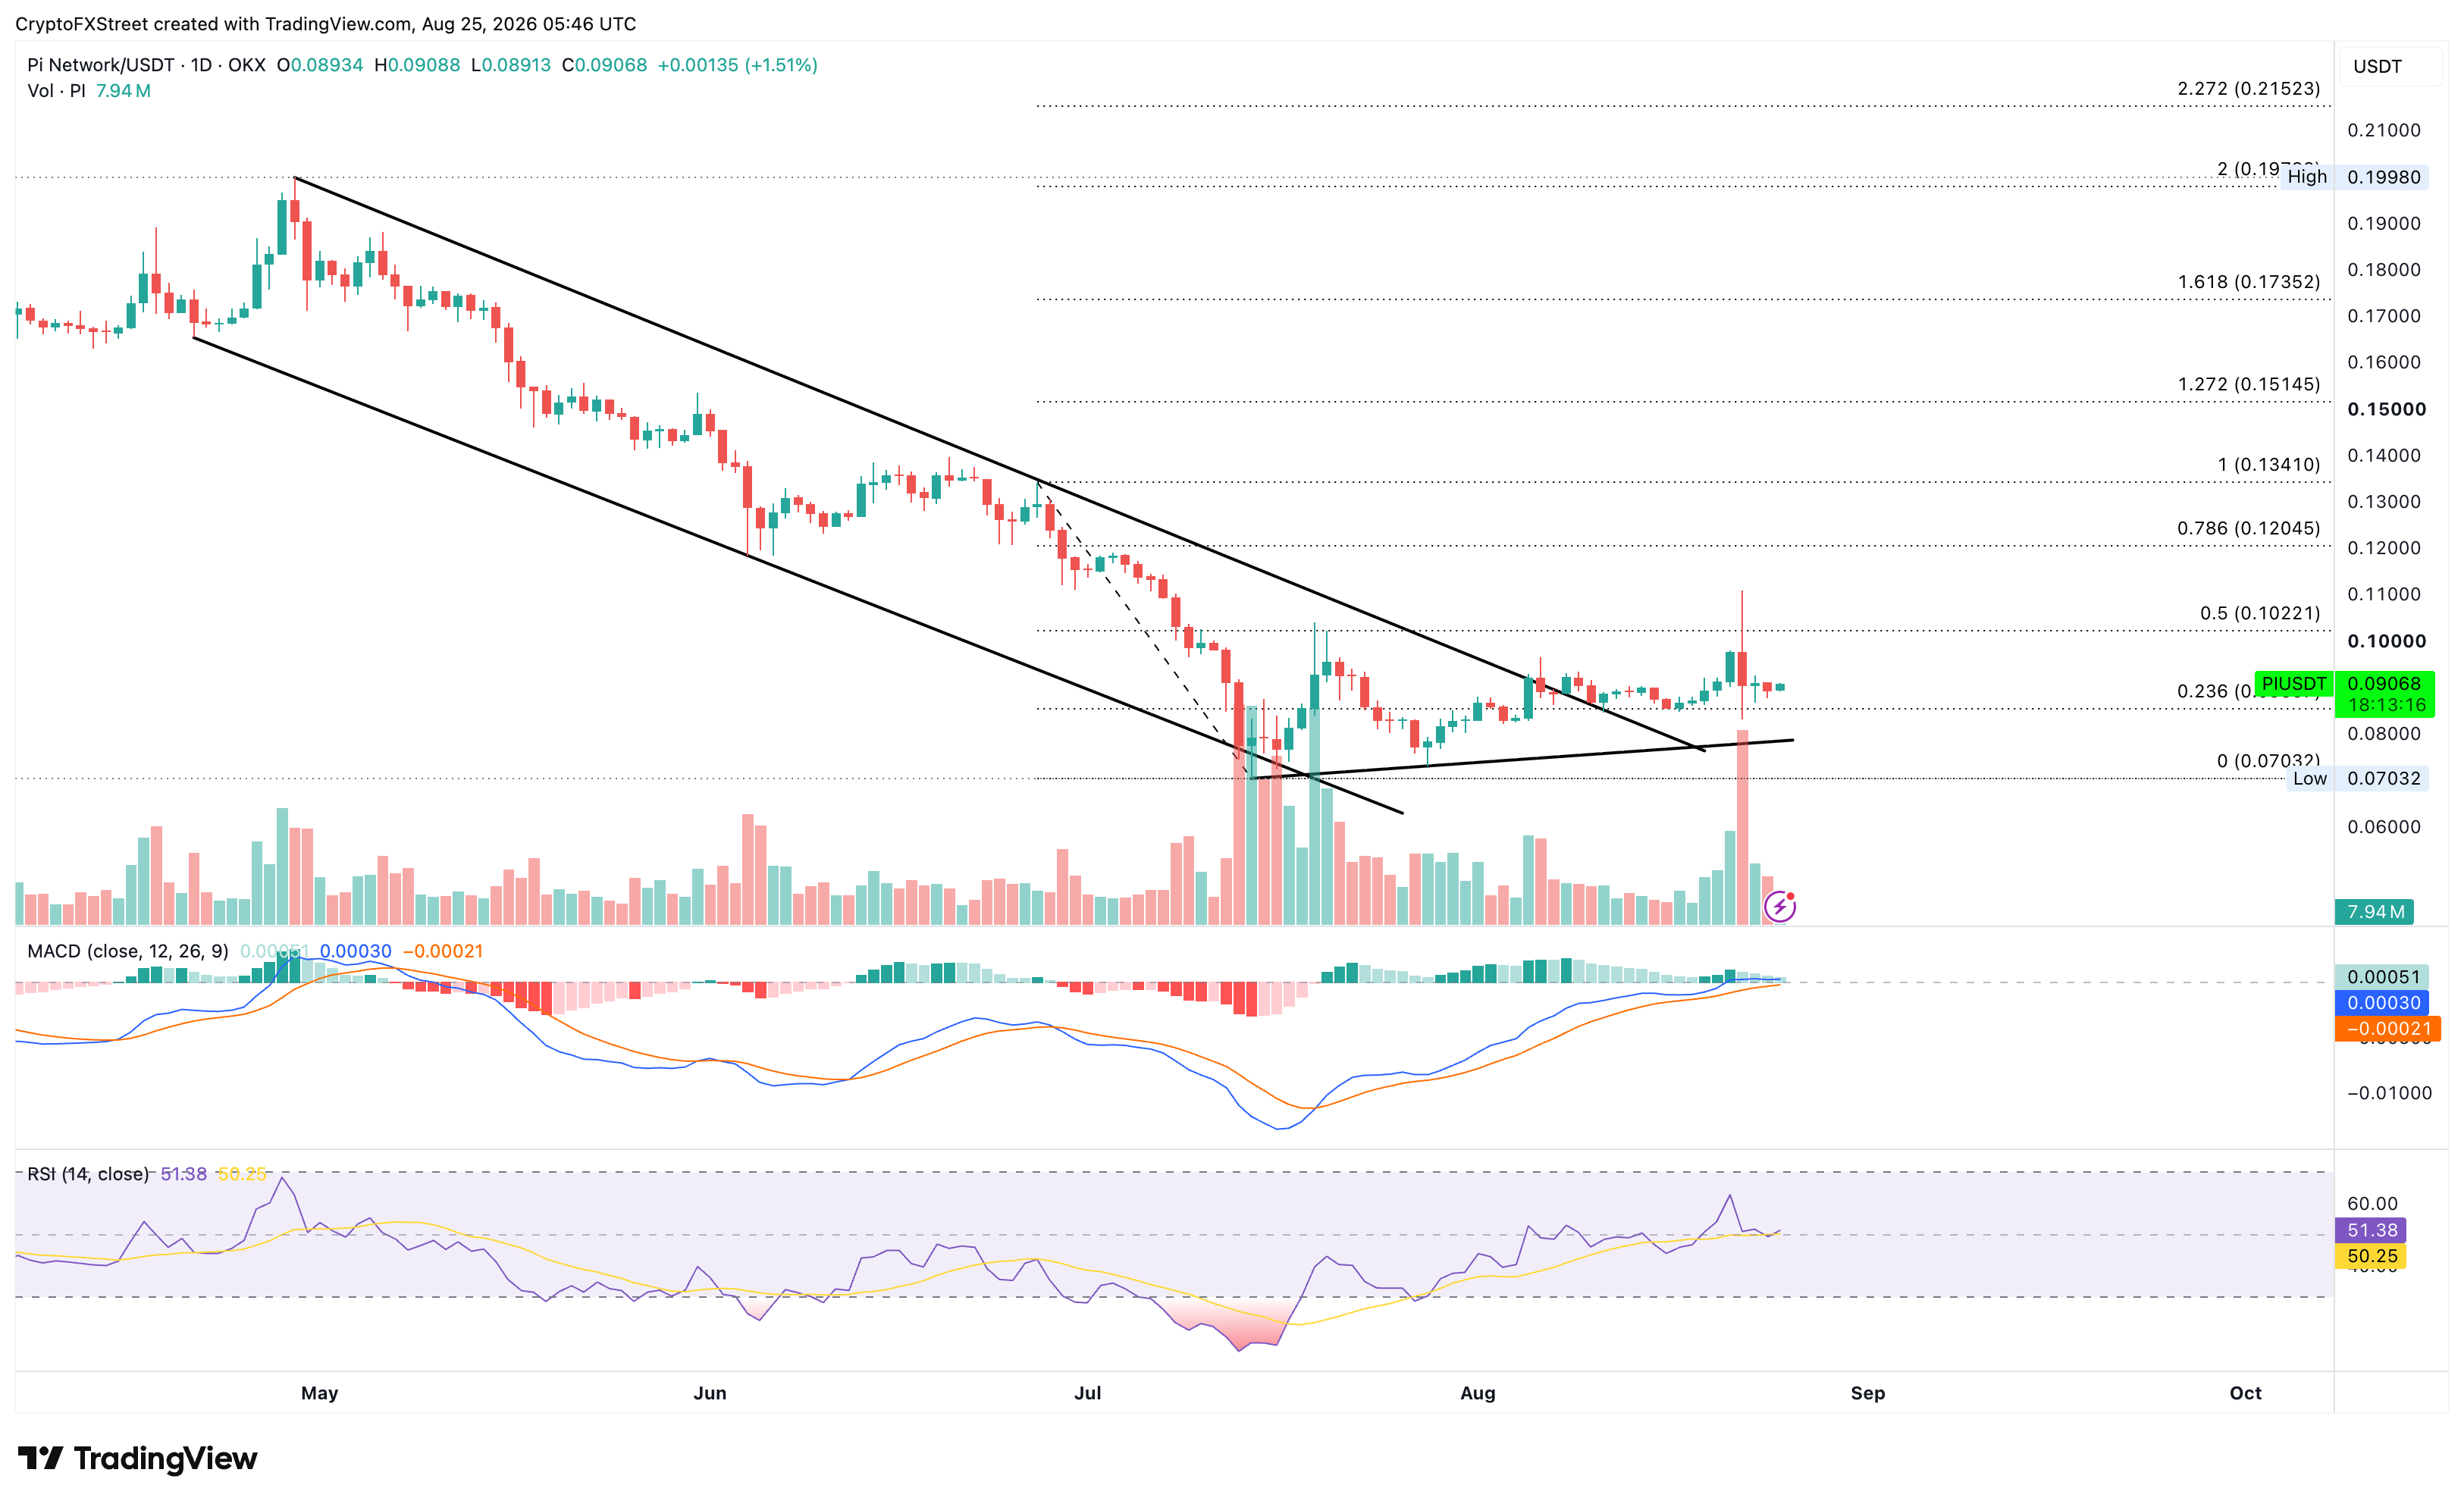
On the downside, the 23.6% Fibonacci retracement at $0.0853 serves as the immediate support level, followed by the ascending support trendline near $0.0785 and the swing low at $0.0703.
(The technical analysis of this story was written with the help of an AI tool. Know more.)
Recommended Articles








Comments (0)
Click the $ button, enter the symbol, and select to link a stock, ETF, or other ticker.