


Bitcoin Price Forecast: BTC stalls as profit-taking starts



- Bitcoin stalls near $77,000 on Monday after surging over 23% last week, marking its strongest weekly gain since mid-March 2023.
- US-listed spot ETFs recorded $1.92 billion in weekly inflows, their highest weekly inflow so far this year and the largest since October 2025.
- On-chain data shows traders may have started taking profits as BTC nears the $80,000 mark.
Bitcoin (BTC) takes a breather, trading around $77,000 on Monday, following a massive rally of over 23% last week, marking its strongest weekly gain since mid-March 2023. The rally was driven by the US Treasury buyback announcement and was supported by institutional demand, with spot Exchange Traded Funds (ETFs) recording $1.92 billion in weekly inflows, their highest weekly inflow since October 2025.
On-chain data suggests traders may have started taking profits as the Crypto King nears the key $80,000 mark, which could lead to short-term consolidation or a pullback.
Profit-taking activity near $80K stalls rally
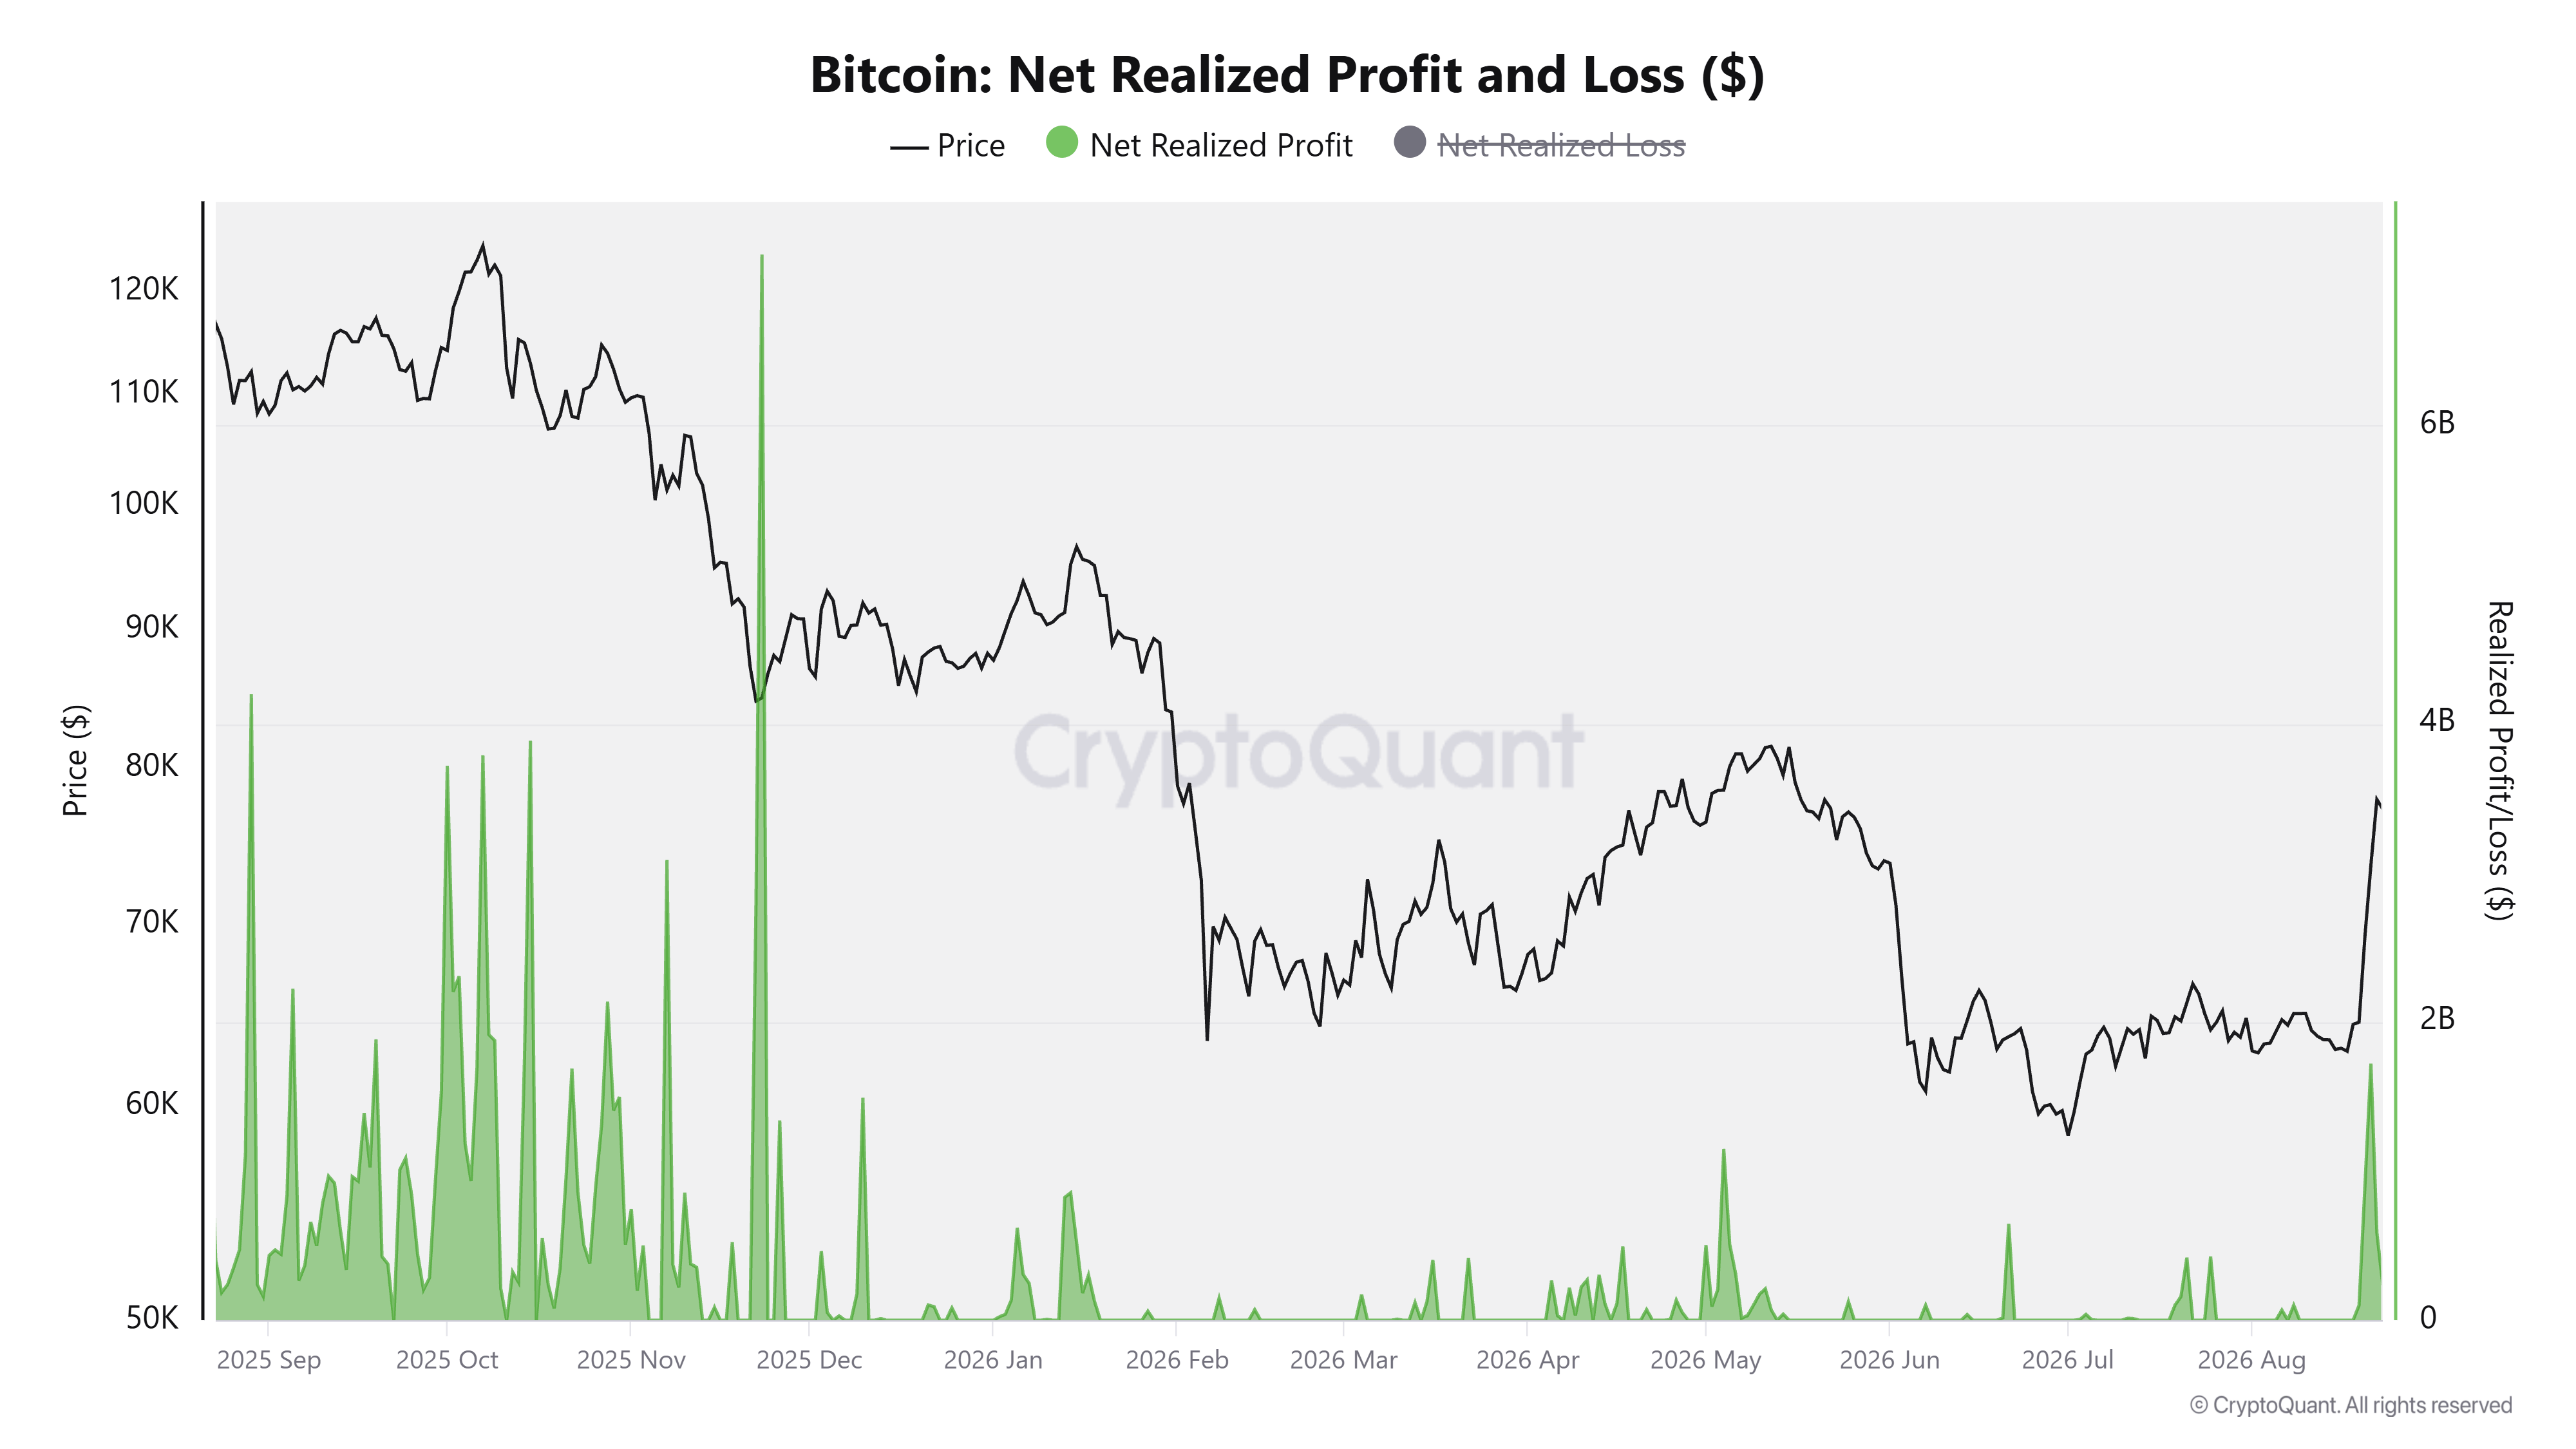
CryptoQuant’s chart below shows that Bitcoin holders realized $1.72 billion in daily profits on Friday, the highest level since the end of November 2024, as last week’s 23% rally pushed many investors back into profitable territory. Historically, this anticipates short-term consolidation or a pullback as traders start to sell.
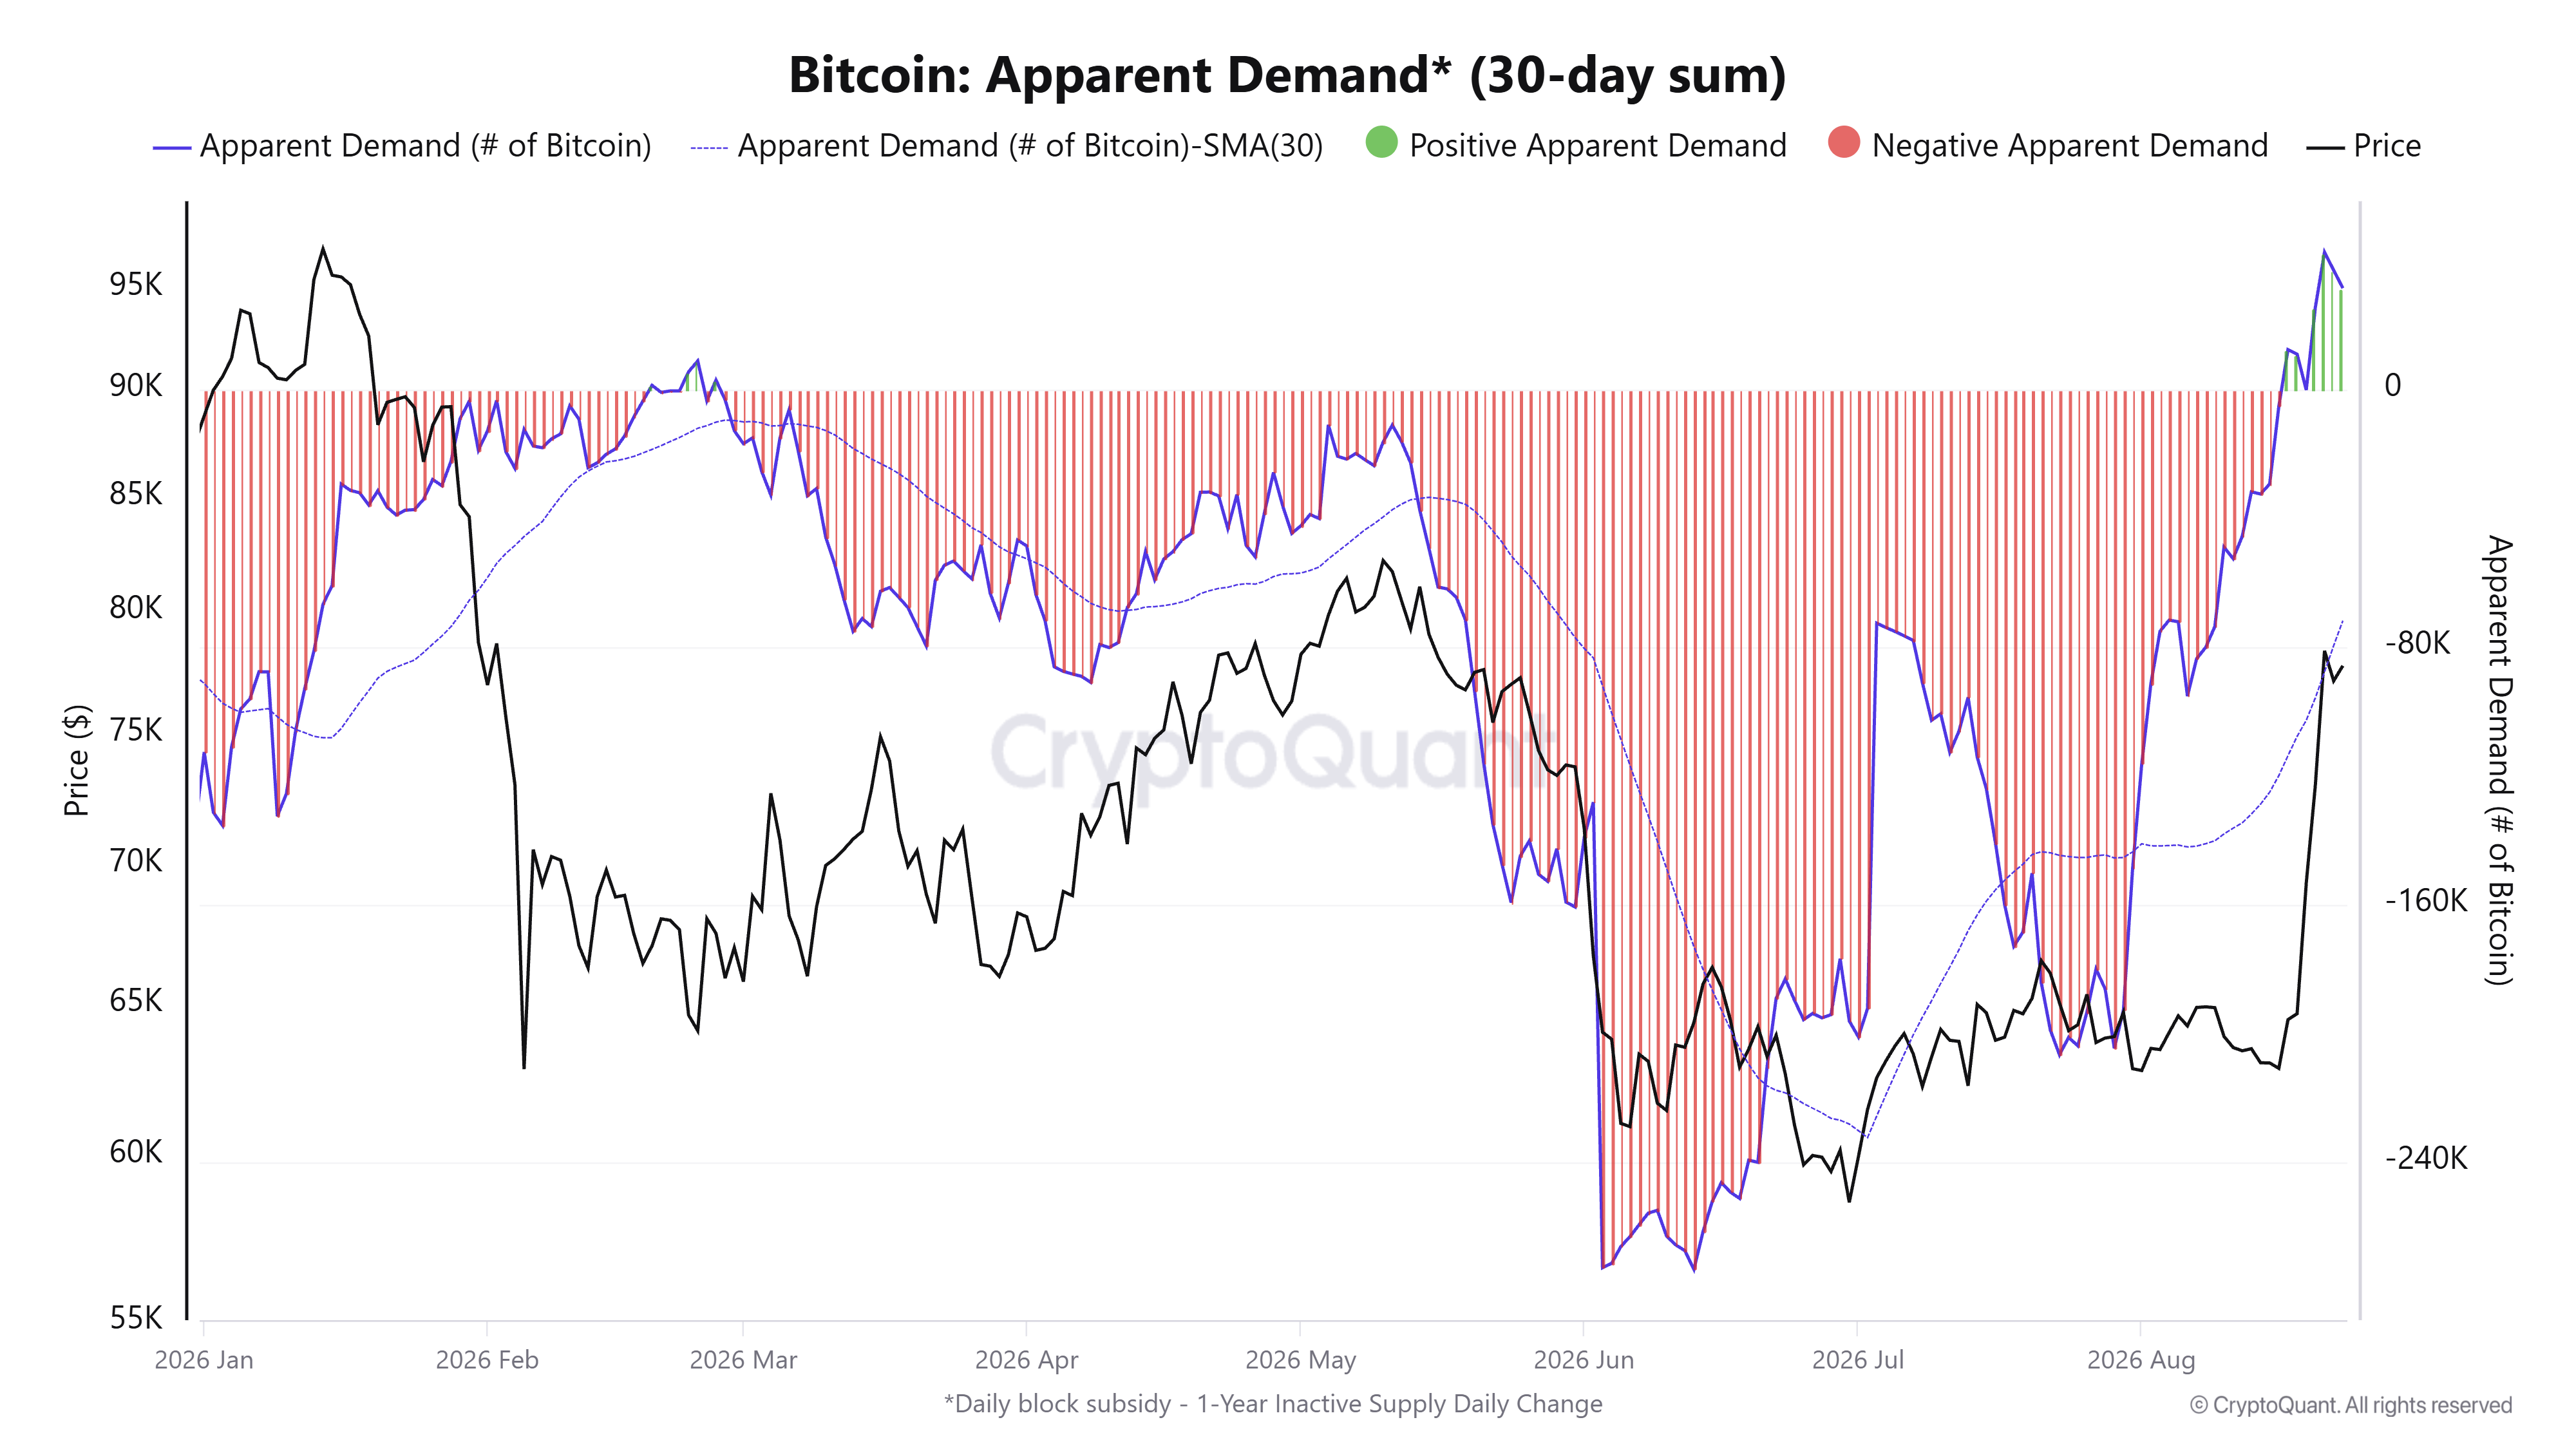
Despite the profit-taking, Bitcoin’s spot demand has flipped into positive territory after remaining negative since the end of February, suggesting that net buying interest has strengthened.
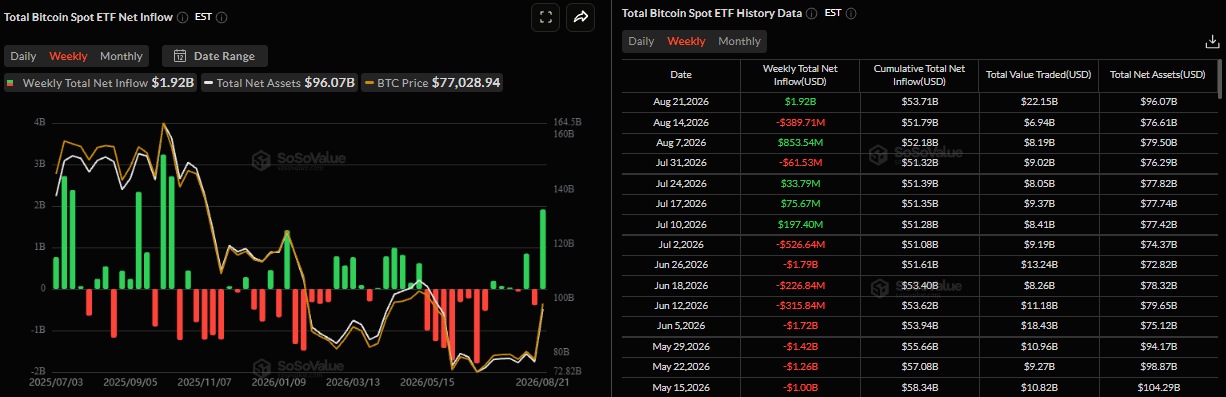
Highest ETF weekly inflow year-to-date
Institutional demand for Bitcoin supported last week’s price rally. SoSoValue data showed spot ETFs recorded $1.92 billion in inflows, their highest weekly inflow so far this year and the largest since mid-October 2025. If this trend continues through this week, BTC could rally further.
Bitcoin technical outlook: BTC nears critical resistance
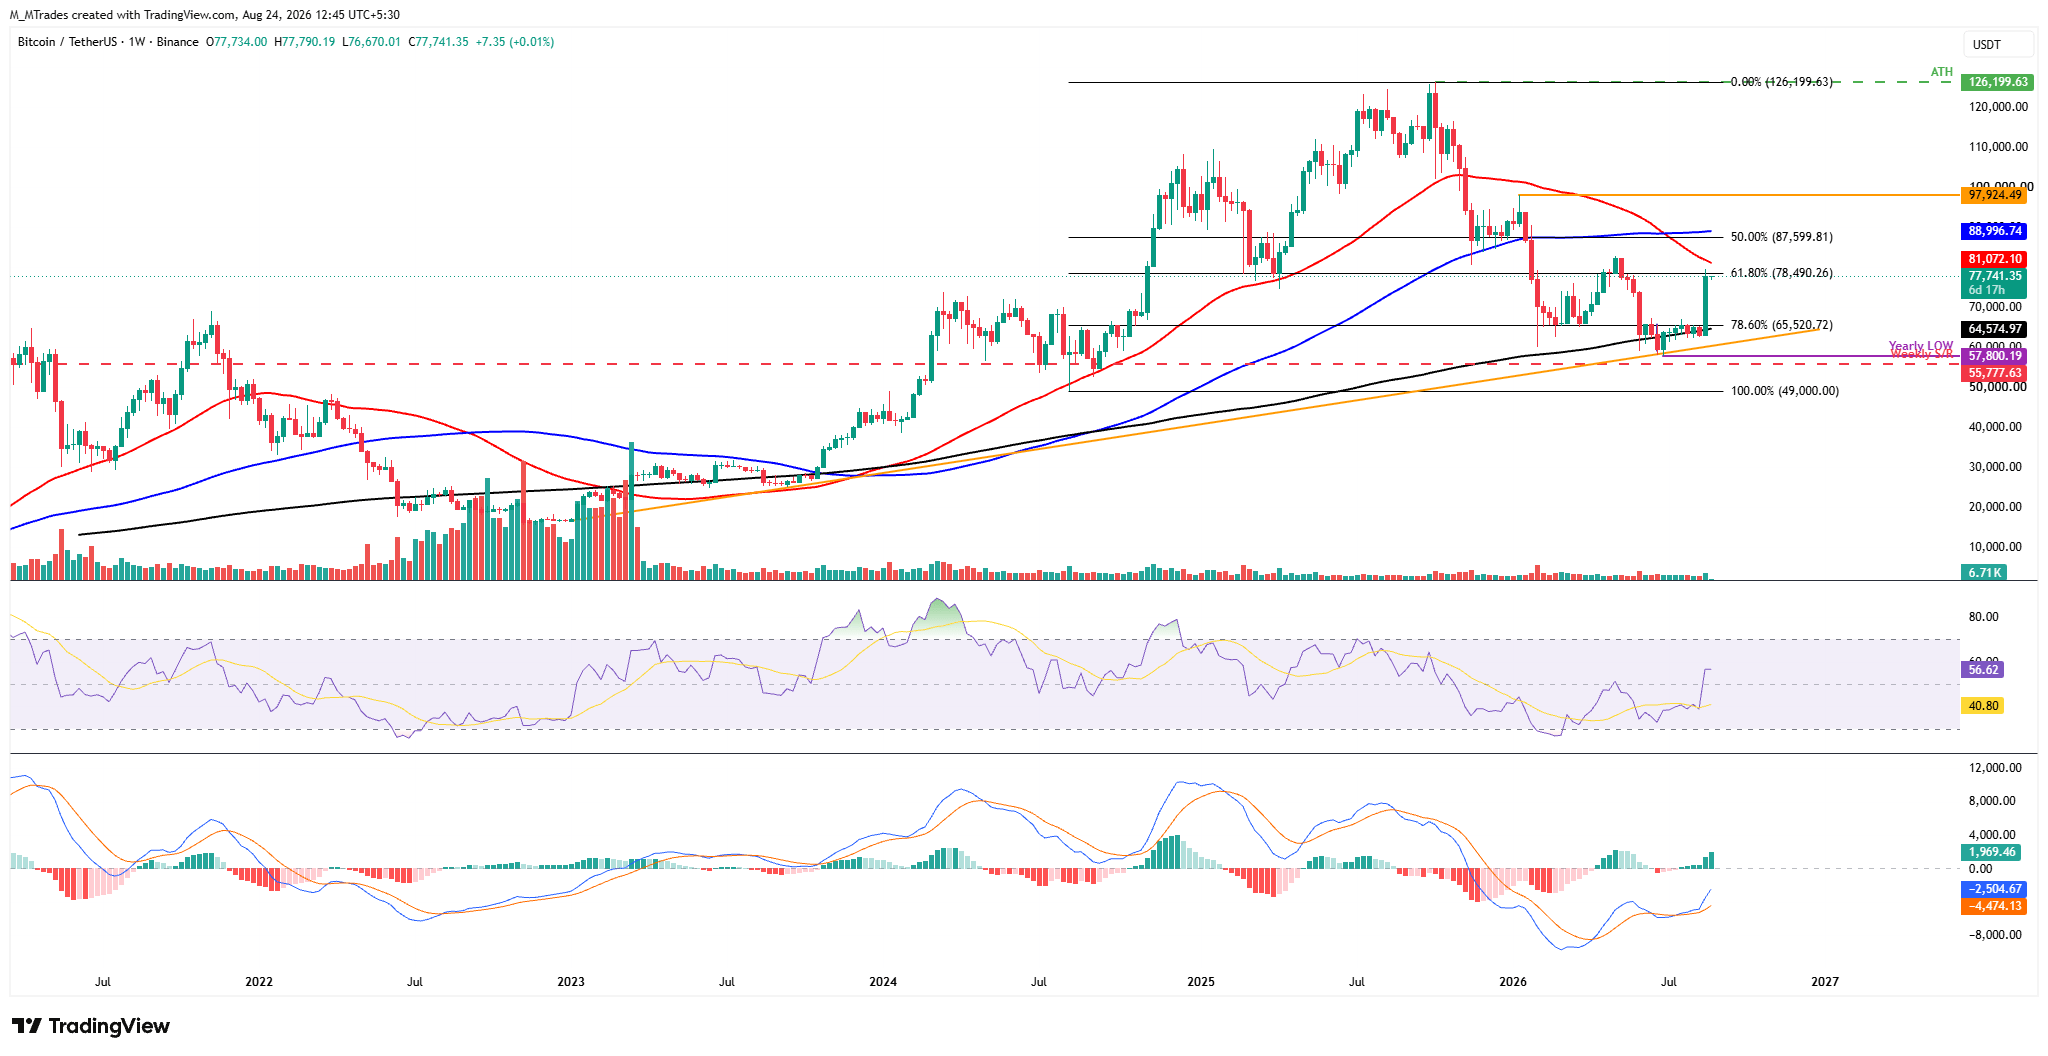
The Crypto King has risen sharply and trades above the 200-week Simple Moving Average (SMA) at $64,571 after weeks of consolidation. Moreover, BTC retested the 61.8% Fibonacci retracement level at $78,490 (drawn from the August 2024 low of $49,000 to the October 2025 record high at $126,199). As of the start of this week, BTC is trading around $77,000.
If BTC closes above the immediate resistance at the 61.8% Fibonacci retracement level at $78,490 on a weekly basis, it could extend the rally toward the 50-week SMA at $81,059. A close above this 50-week SMA could extend further gains toward the 50% retracement level at $87,599, which roughly coincides with the 100-week SMA at $88,990.
Momentum remains strong and shows signs of optimism. On the weekly chart, the Relative Strength Index (RSI) stays firmly above the neutral level of 50, reading 55 on Monday, indicating improving momentum. In addition, the Moving Average Convergence Divergence (MACD) flipped to a bullish crossover in mid-July and remains intact, with rising green histogram bars, supporting a positive outlook.
However, traders should remain cautious as such a massive rally suggests a mild pullback or consolidation may occur before the upside move continues, as shown by the profit-taking activity discussed above. If BTC corrects, it could extend the decline toward the key psychological level of $70,000.
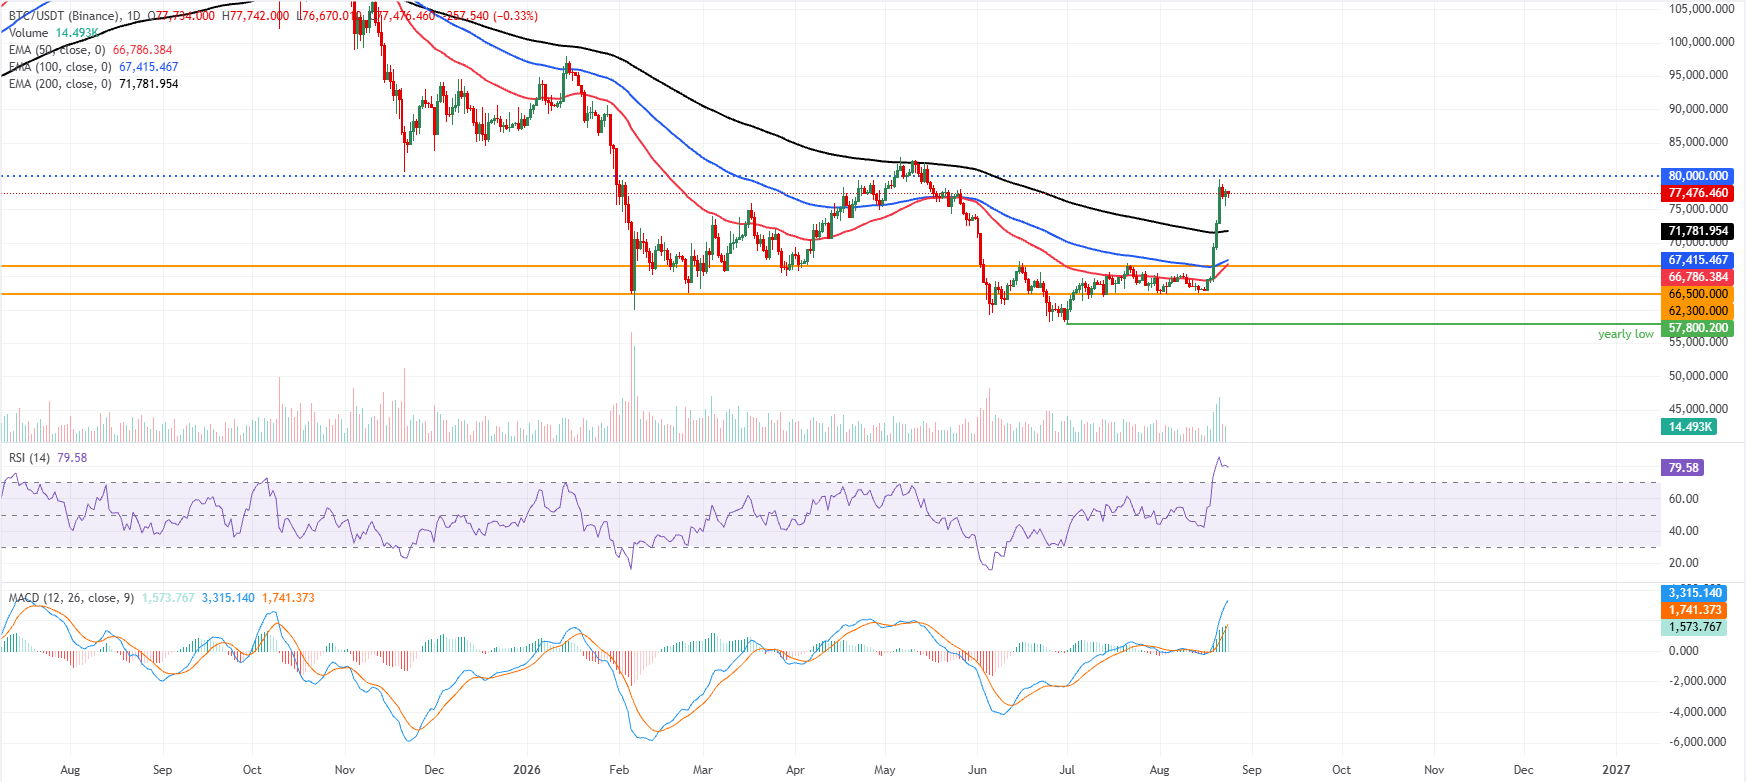
On the daily chart, the Crypto King maintains a firm bullish bias as price holds well above the 50-day, 100-day, and 200-day Exponential Moving Averages (EMAs) at $66,786, $67,415, and $71,781, respectively.
The strong advance of recent sessions has pushed the daily RSI deep into overbought territory near 79. At the same time, the MACD remains firmly positive, with the line well above zero and prior strong expansion hinting at robust but stretched upside momentum.
On the downside, initial support is seen at the 200-day EMA around $71,781, ahead of a broader demand band formed by the 100-day EMA at $67,415, the 50-day EMA at $66,786 and the horizontal level at $66,500. A deeper pullback would expose the lower horizontal floor at $62,300.
On the topside, the next notable resistance is the psychological barrier at $80,000, where overbought conditions could encourage profit-taking and a consolidation phase.
(The technical analysis of this story was written with the help of an AI tool. Know more.)
Bitcoin, altcoins, stablecoins FAQs
Bitcoin is the largest cryptocurrency by market capitalization, a virtual currency designed to serve as money. This form of payment cannot be controlled by any one person, group, or entity, which eliminates the need for third-party participation during financial transactions.
Altcoins are any cryptocurrency apart from Bitcoin, but some also regard Ethereum as a non-altcoin because it is from these two cryptocurrencies that forking happens. If this is true, then Litecoin is the first altcoin, forked from the Bitcoin protocol and, therefore, an “improved” version of it.
Stablecoins are cryptocurrencies designed to have a stable price, with their value backed by a reserve of the asset it represents. To achieve this, the value of any one stablecoin is pegged to a commodity or financial instrument, such as the US Dollar (USD), with its supply regulated by an algorithm or demand. The main goal of stablecoins is to provide an on/off-ramp for investors willing to trade and invest in cryptocurrencies. Stablecoins also allow investors to store value since cryptocurrencies, in general, are subject to volatility.
Bitcoin dominance is the ratio of Bitcoin's market capitalization to the total market capitalization of all cryptocurrencies combined. It provides a clear picture of Bitcoin’s interest among investors. A high BTC dominance typically happens before and during a bull run, in which investors resort to investing in relatively stable and high market capitalization cryptocurrency like Bitcoin. A drop in BTC dominance usually means that investors are moving their capital and/or profits to altcoins in a quest for higher returns, which usually triggers an explosion of altcoin rallies.
Recommended Articles








Comments (0)
Click the $ button, enter the symbol, and select to link a stock, ETF, or other ticker.