


Crypto Today: Bitcoin, Ethereum, XRP edge lower despite renewed ETF inflows



- Bitcoin corrects below $64,000 despite returning inflows into spot ETFs.
- Ethereum upside remains capped under the 100-day EMA as the down leg extends below $1,900.
- XRP trades broadly sideways in the $1.05-$1.10 range amid over $7 million in ETF inflows so far this week.
The cryptocurrency market broadly corrects on Friday, as investors assess macro uncertainty and geopolitical tensions, which continue to escalate in the Middle East. Bitcoin (BTC) is trading below $64,000, down from the weekly high of $65,745. Altcoins such as Ethereum (ETH) and Ripple (XRP) are trading under increasing selling pressure below $1,900 and $1.10, respectively.
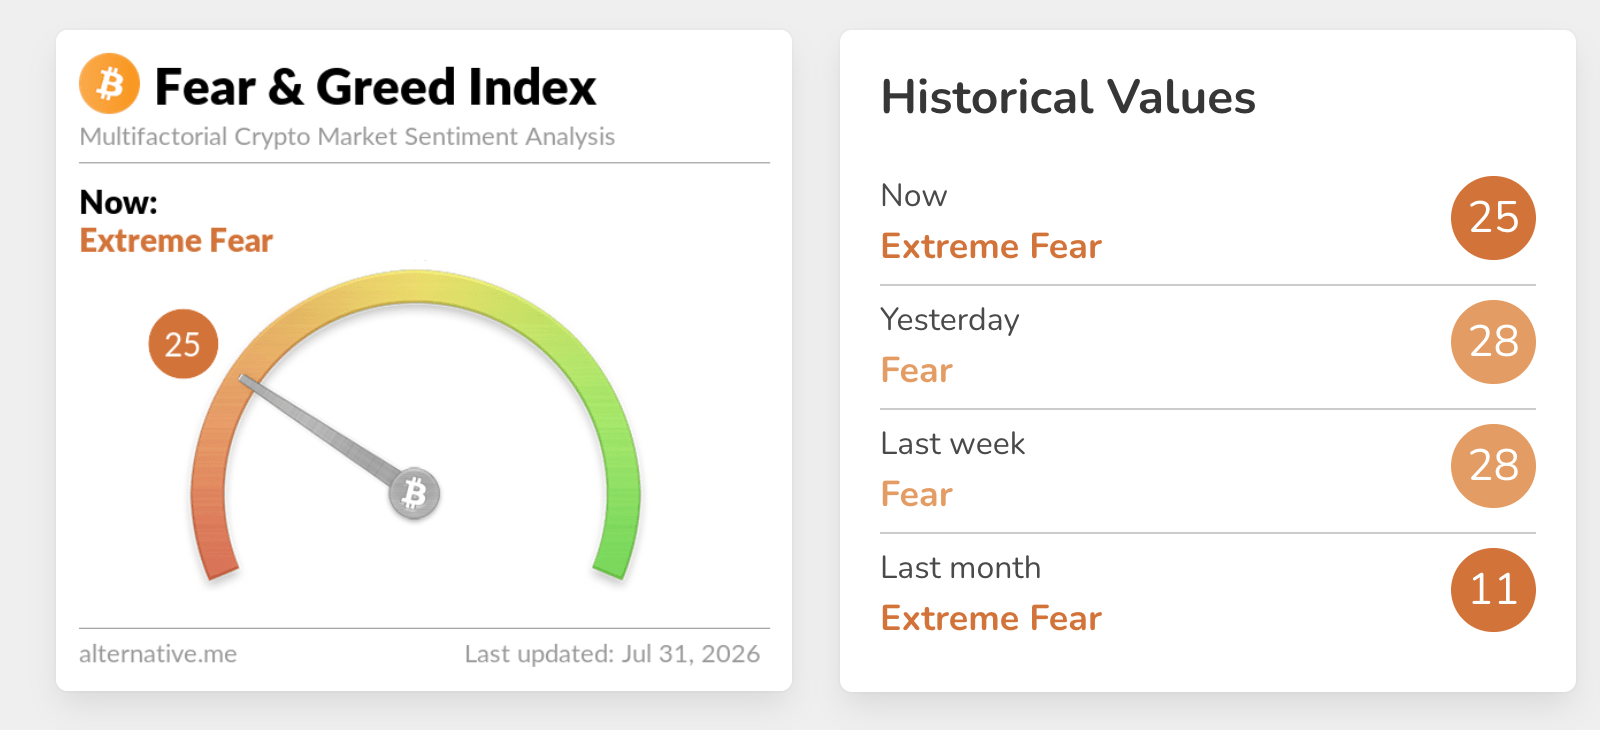
Risk appetite has continued to wane this week, with the Fear & Greed Index slipping to 25, firmly in Fear territory, down from 28 just a day earlier.
ETF inflows extend despite inflation concerns
The Federal Reserve (Fed) left interest rates unchanged in the 3.50%-3.75% range on Wednesday. Three of the central bank officials dissented, favoring a 25 basis point hike, which raised inflation concerns, “driving a sharp repricing across rates and equities before strong earnings helped stabilize sentiment,” as highlighted by analysts at Crypto Finance.
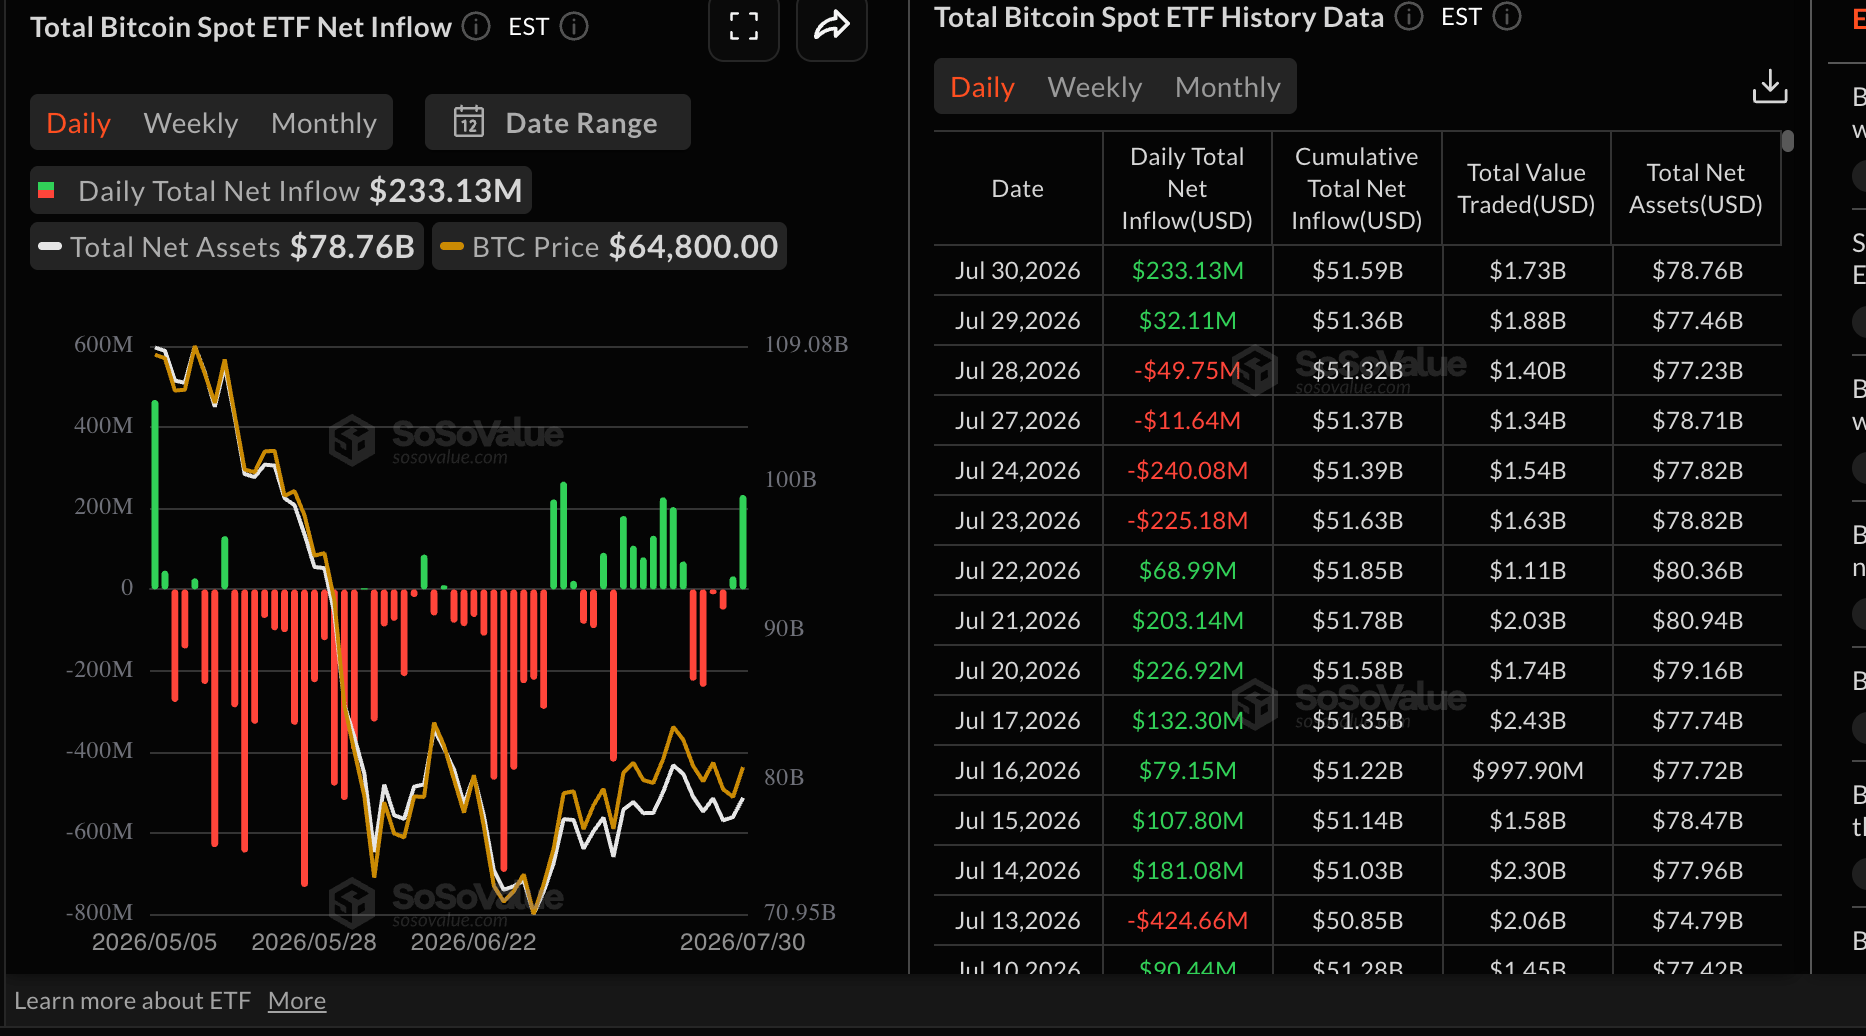
Institutional investors appear to be gazing beyond the macro uncertainty and Middle East war headlines. Inflows into spot Exchange-Traded Funds (ETFs) increased to $233 million on Thursday, from $32 million the previous day. According to SoSoValue data, BTC ETFs’ cumulative inflows are nearly $52 billion, underscoring the long-term positive investor outlook.
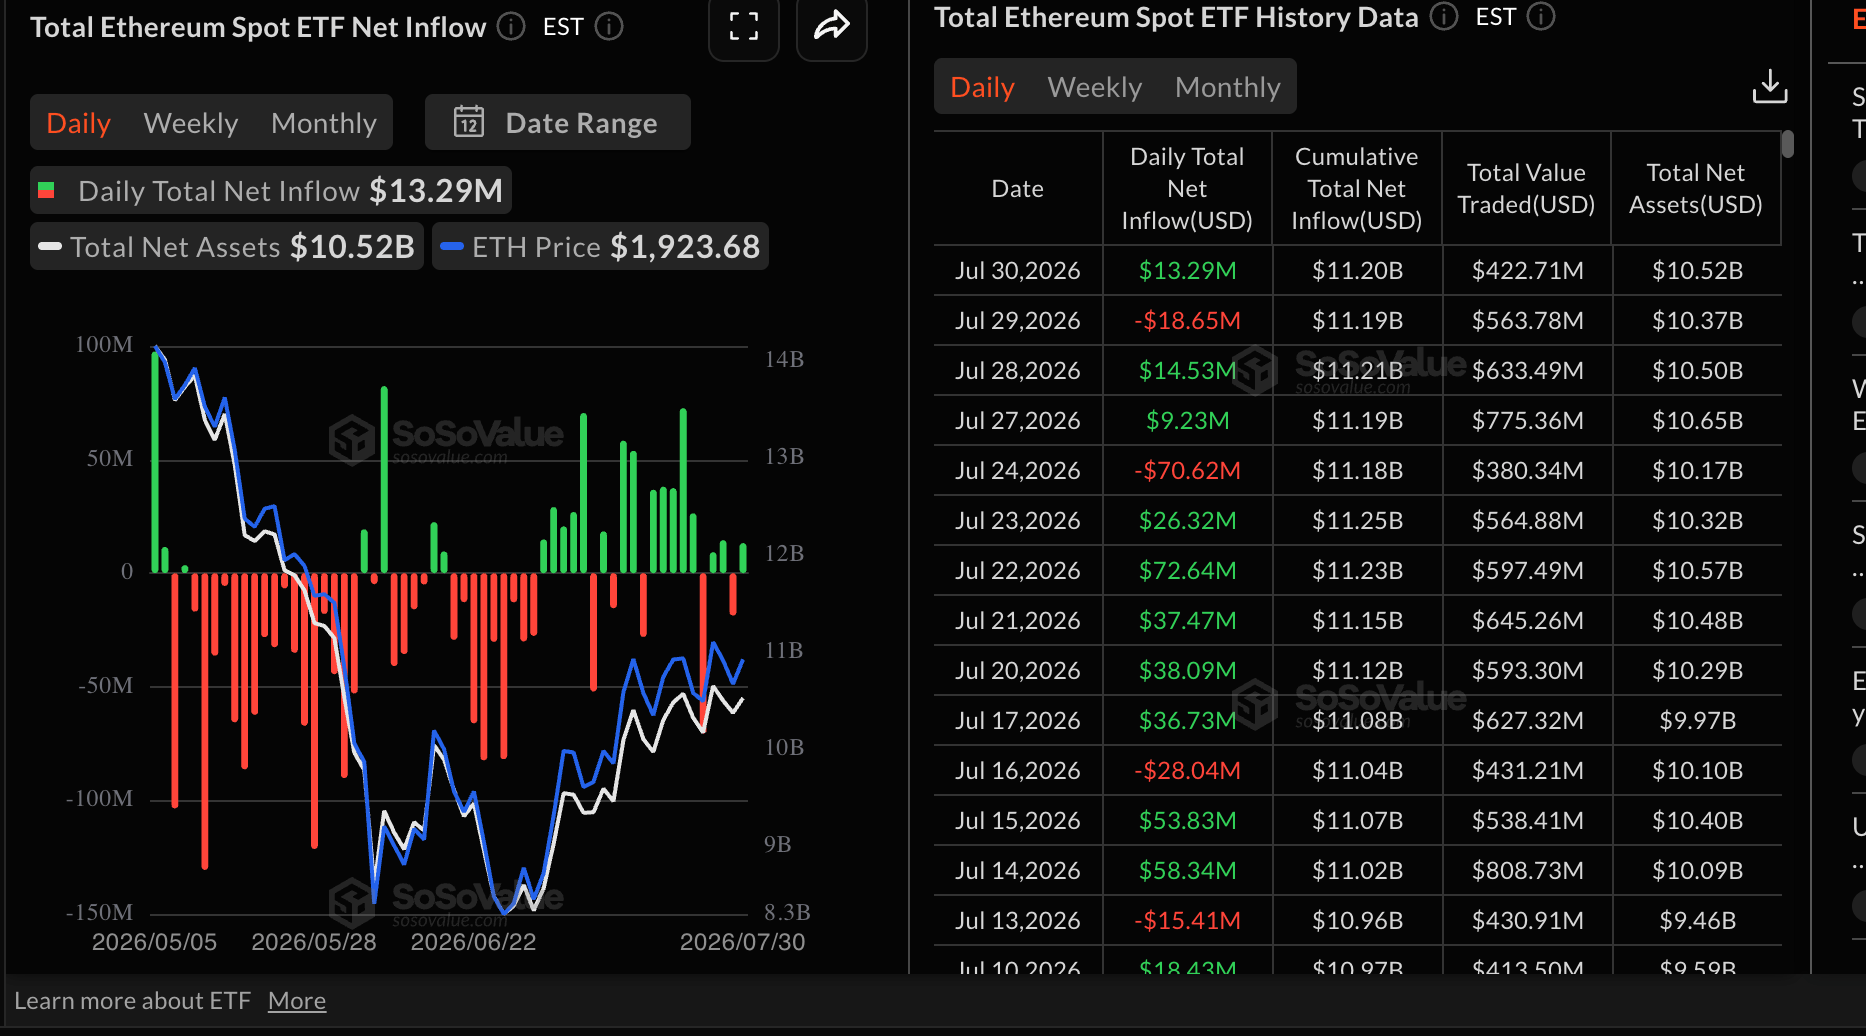
Ethereum spot ETF inflows have been largely nuanced this week, with roughly $13 million on Thursday. Outflows totaled $19 million on Wednesday, following $9 million and $15 million in inflows on Monday and Tuesday.
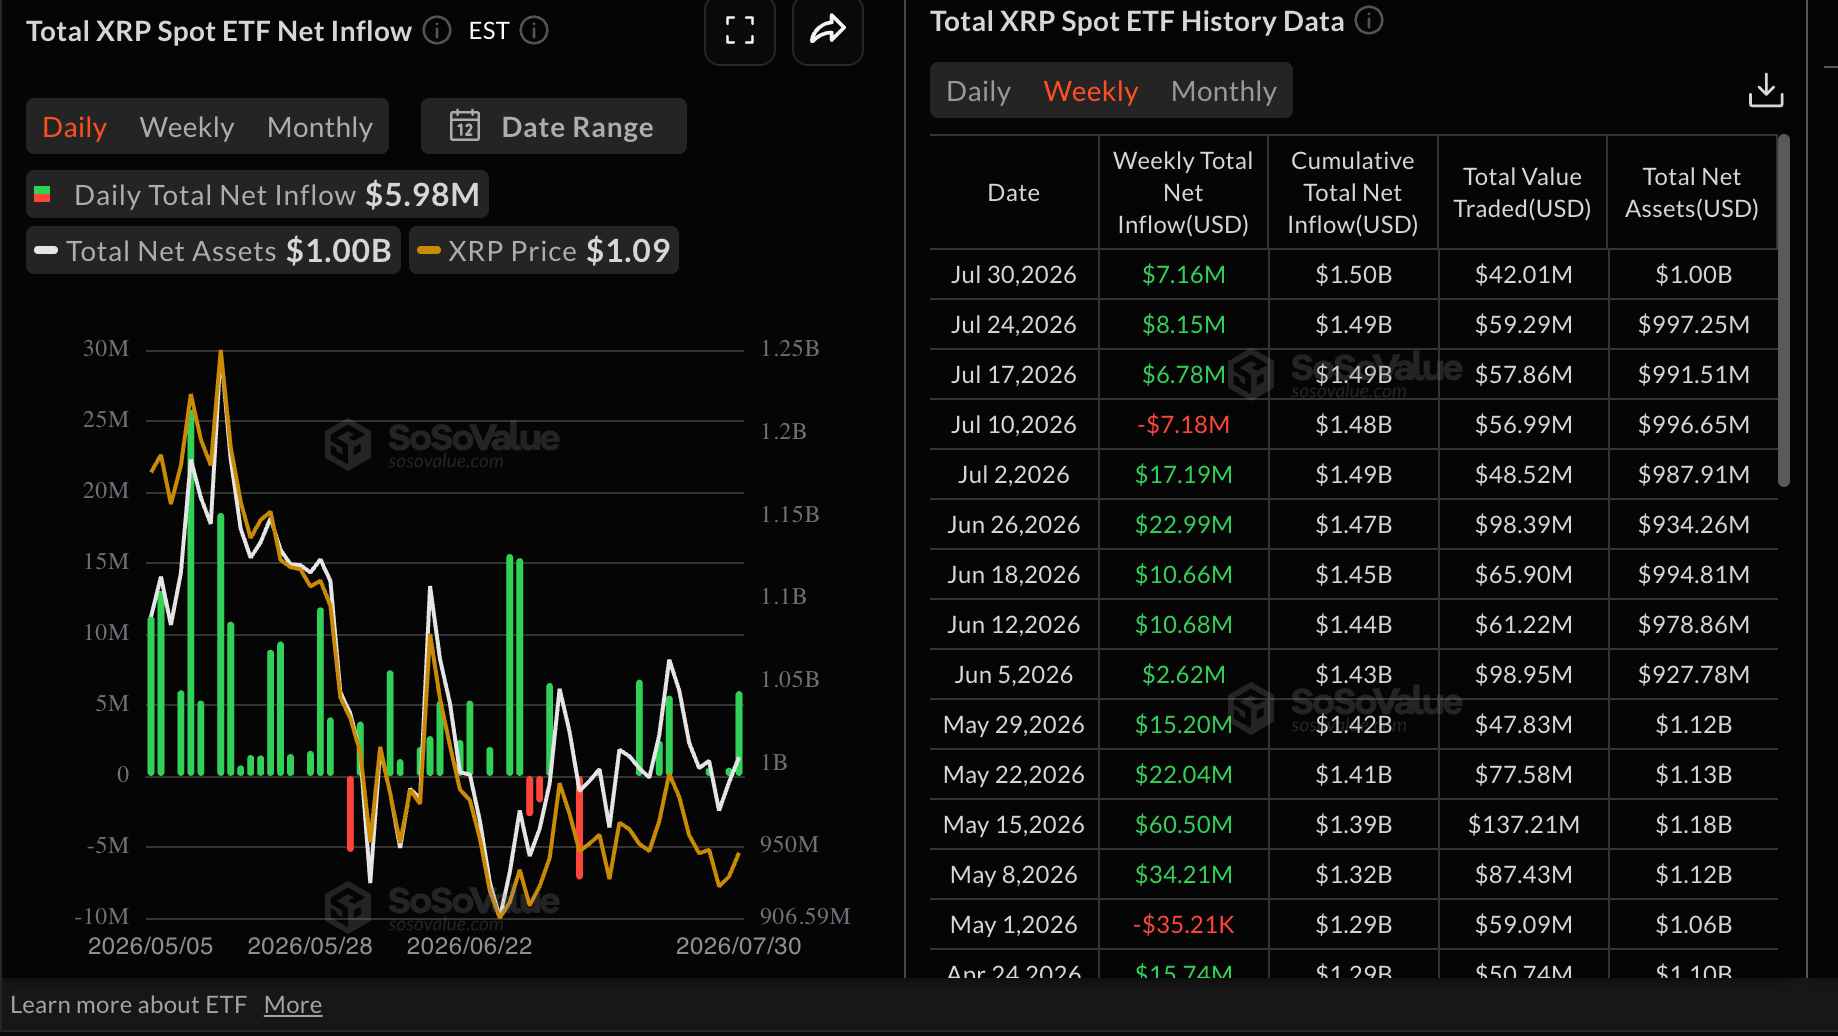
As for XRP spot ETFs, inflows surged to nearly $6 million on Thursday, up from a mere $585,000 the day before. So far this week, cumulative inflows stand slightly above $7 million through Thursday. The surge underpins growing risk-on sentiment for XRP investment products, despite the overall crypto market’s dull outlook.
Technical Analysis: Bitcoin falters amid a dominant bearish outlook
Bitcoin trades around $63,969, keeping a bearish near-term tone as it holds below the 50-day, 100-day and 200-day Exponential Moving Averages (EMAs). The short-term 50-day EMA at $64,904 is the nearest cap overhead, reinforcing a corrective bias while price stays under this cluster of longer-term averages.
Momentum conditions are soft, with the Relative Strength Index (RSI) hovering just below the midline on the daily chart and the Moving Average Convergence Divergence (MACD) histogram in negative territory, which together suggest downside pressure is still present even if not yet impulsive.
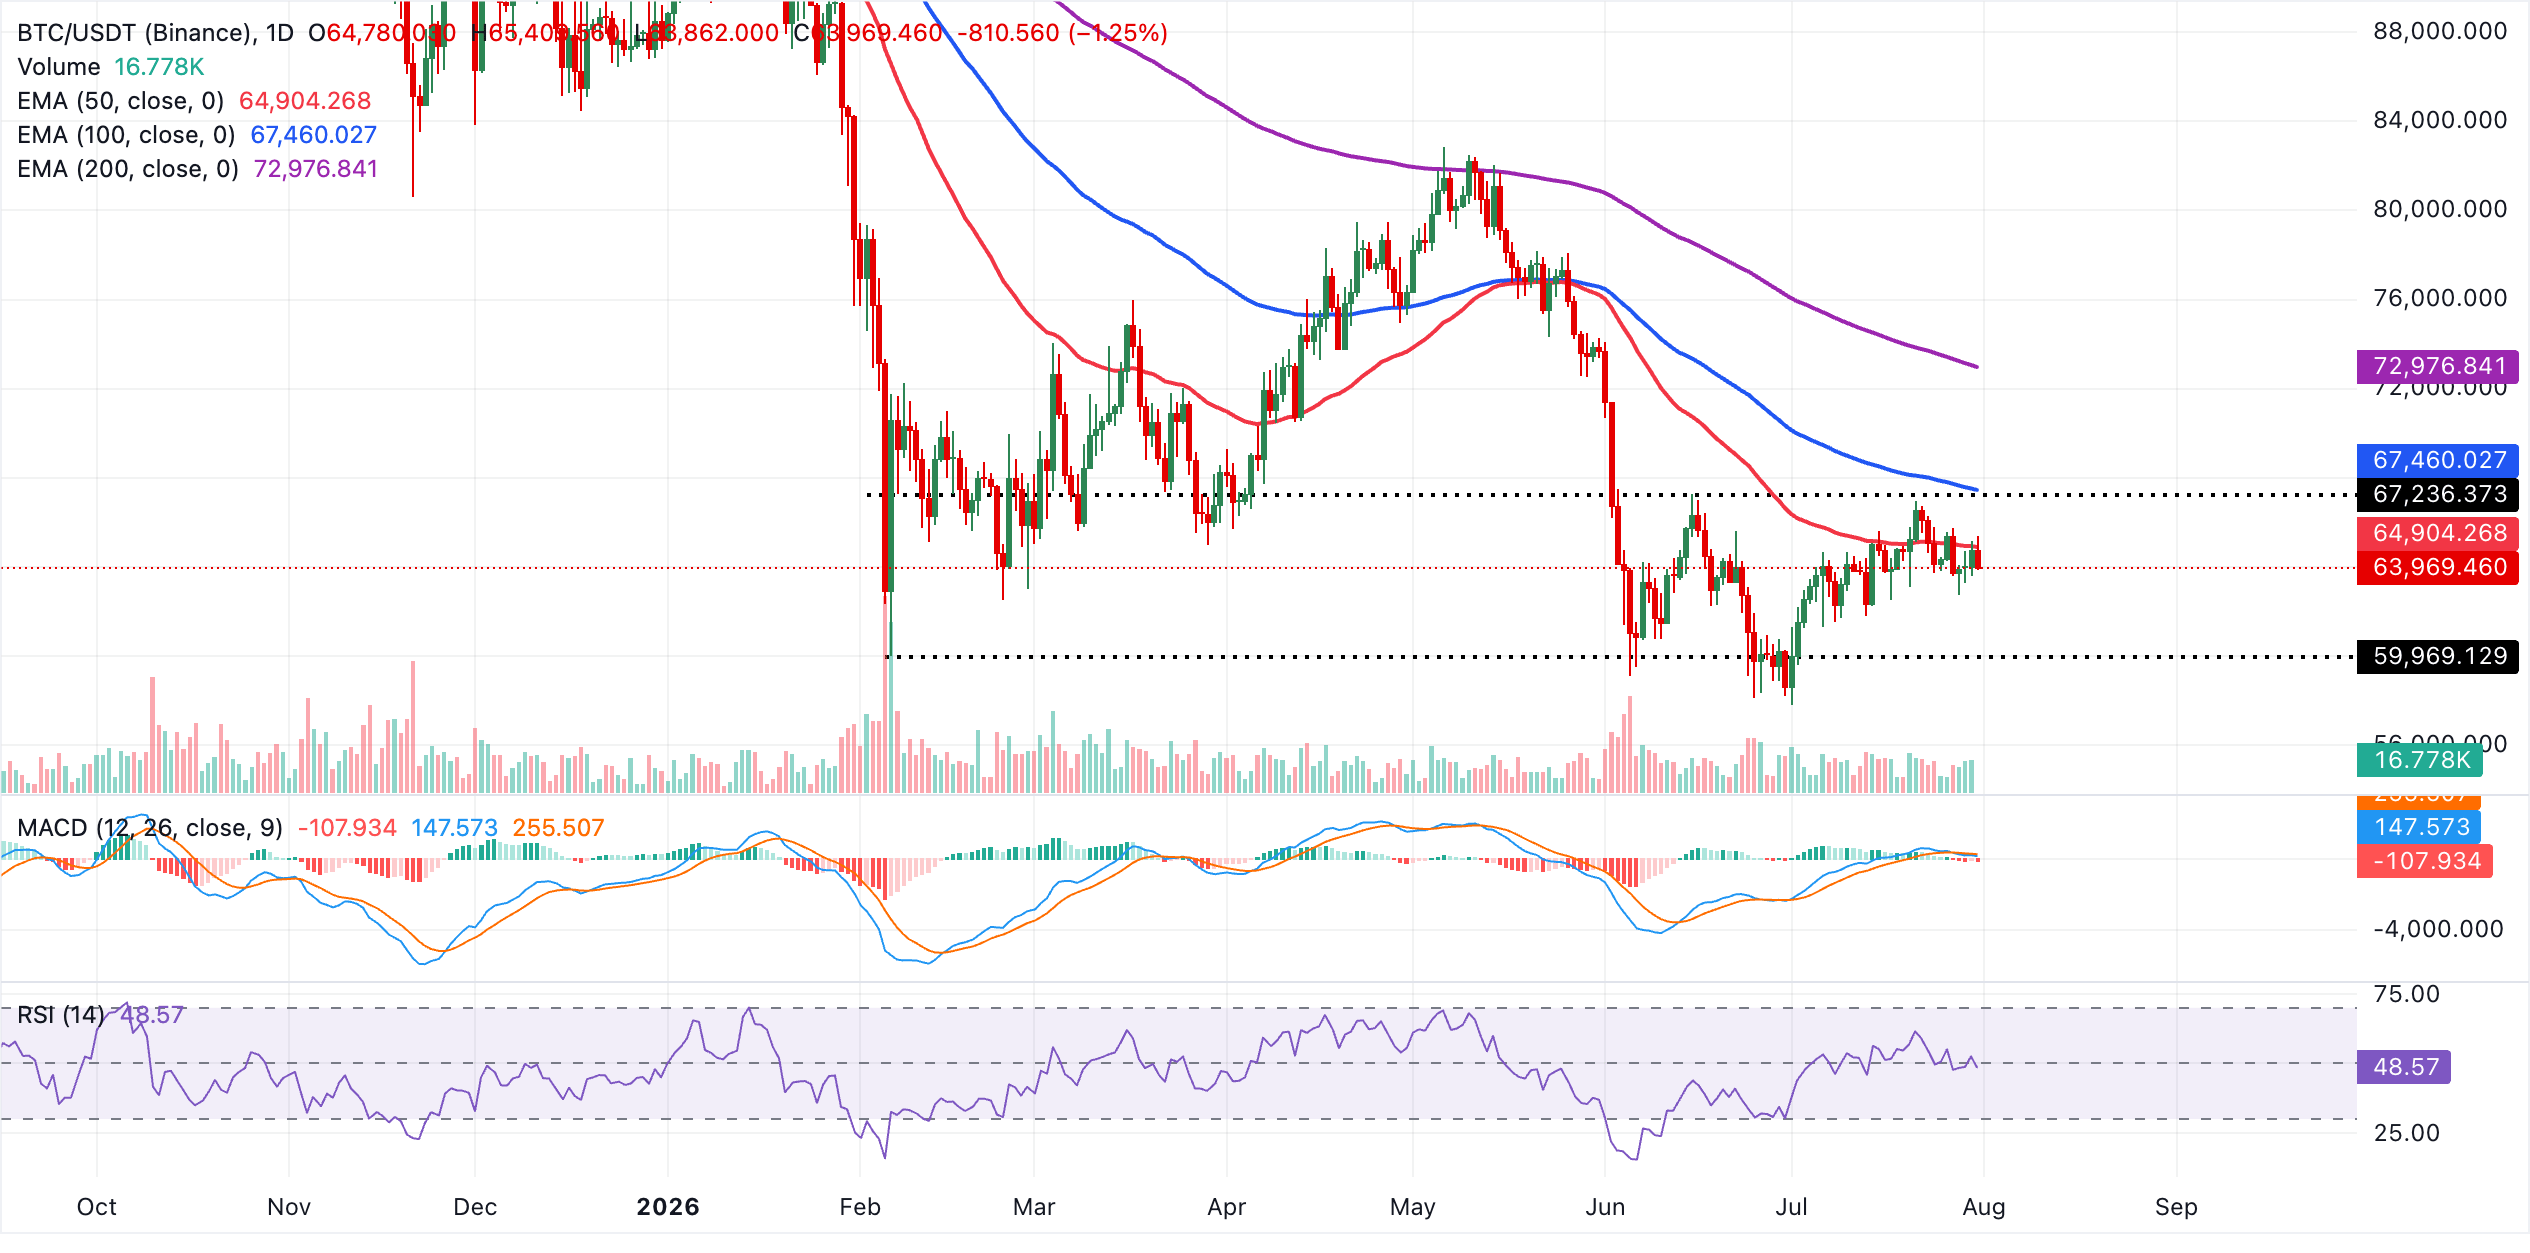
Immediate resistance emerges at the 50-day EMA around $64,904, followed by the 100-day EMA at $67,460, while the 200-day EMA at approximately $72,977 forms a more strategic barrier that would need to be reclaimed to ease the broader downside risk. On the downside, the absence of nearby indicator-based supports on this timeframe implies that any further slide could seek validation from prior price lows and round-number areas including $62,000 and $60,000, respectively.
"The inability of bears to gain meaningful traction is becoming almost as notable as the absence of a fresh bullish catalyst," analysts at Crypto Finance added.
Altcoin technical outlook: Ethereum and XRP face renewed headwinds
Ethereum trades near $1,890, extending its decline from the weekly high of $1,981. Meanwhile, the pair remains capped beneath the 100-day EMA around $1,932 and well below the 200-day EMA at $2,173, keeping the broader tone bearish despite holding above the 50-day EMA around $1,850.
The spot price is hovering around a descending resistance trendline pivot, suggesting that sellers are still defending the recovery, while the RSI near 54 hints at only modest positive momentum and the MACD slipping into negative territory suggests rallies could continue to struggle against overhead supply.
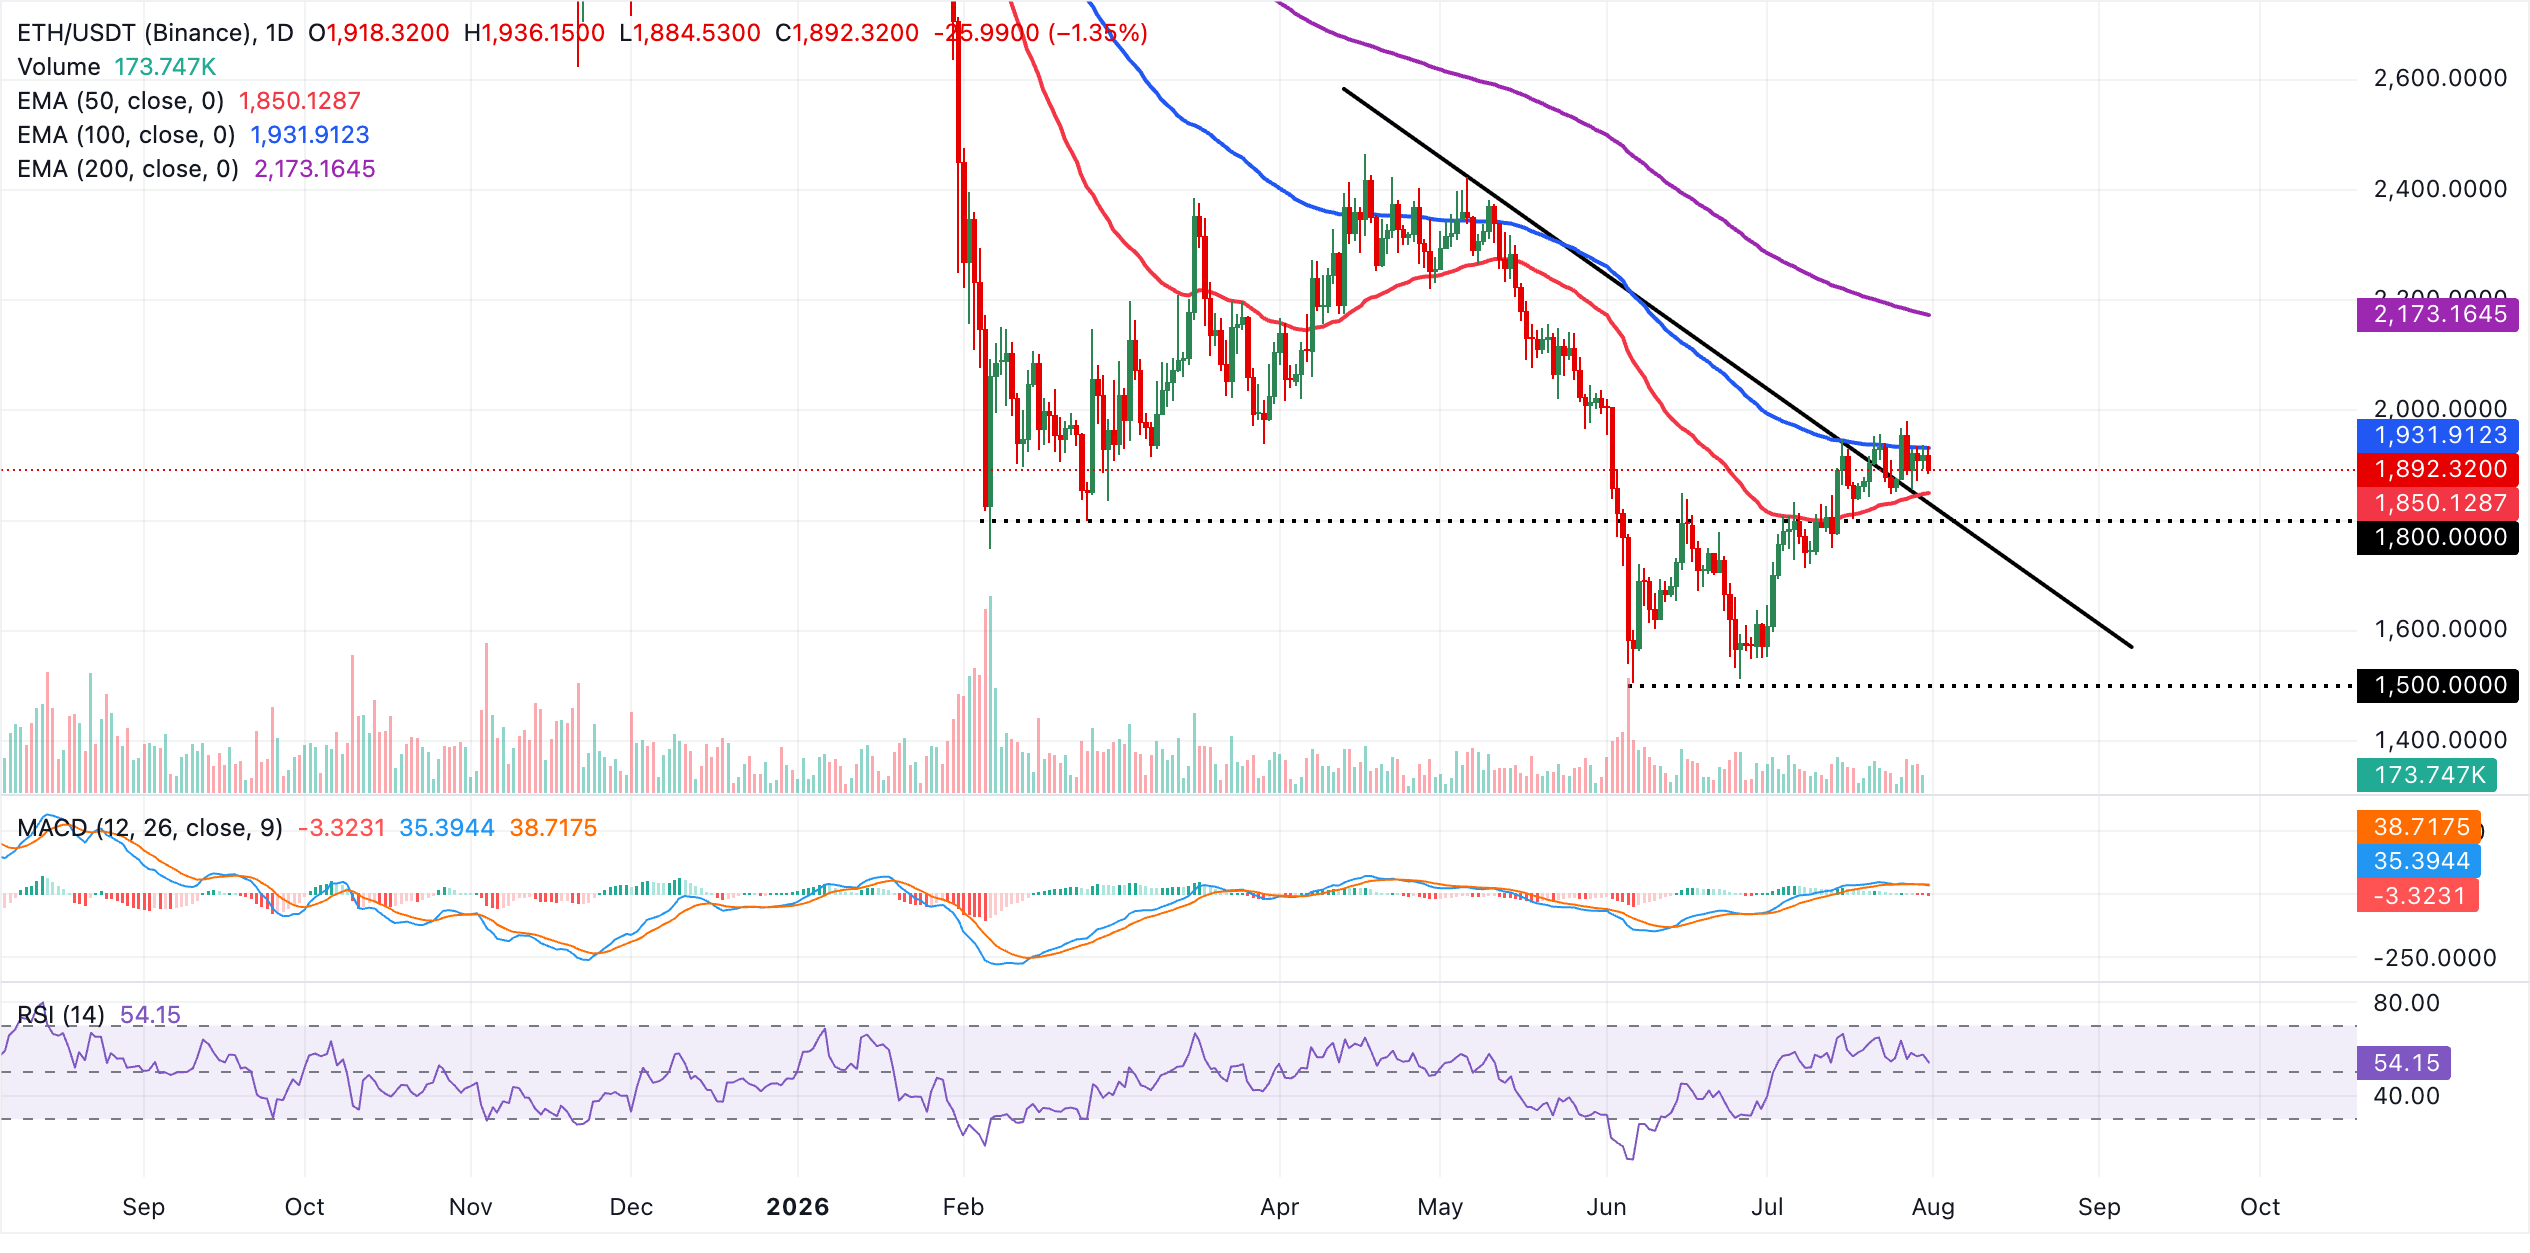
On the topside, immediate resistance lies at the nearby descending trendline pivot around $1,892, with a break higher exposing the 100-day EMA at $1,932, followed by a stronger barrier at the 200-day EMA near $2,173. On the downside, the 50-day EMA around 1,850 offers initial support. A daily close below this moving average would reinforce the bearish bias and open the door to a deeper retracement toward lower levels like $1,800 and $1,600, respectively.
XRP, on the other hand, trades at $1.07, keeping a bearish near-term tone as price holds below the 50-day, 100-day, and 200-day EMAs at $1.13, $1.21, and $1.41, respectively. Momentum indicators align with this capped structure, with the RSI hovering near 44 and the MACD line remaining slightly negative, which together suggest that any rebounds are likely to face selling pressure while the pair trades under these clustered EMAs.
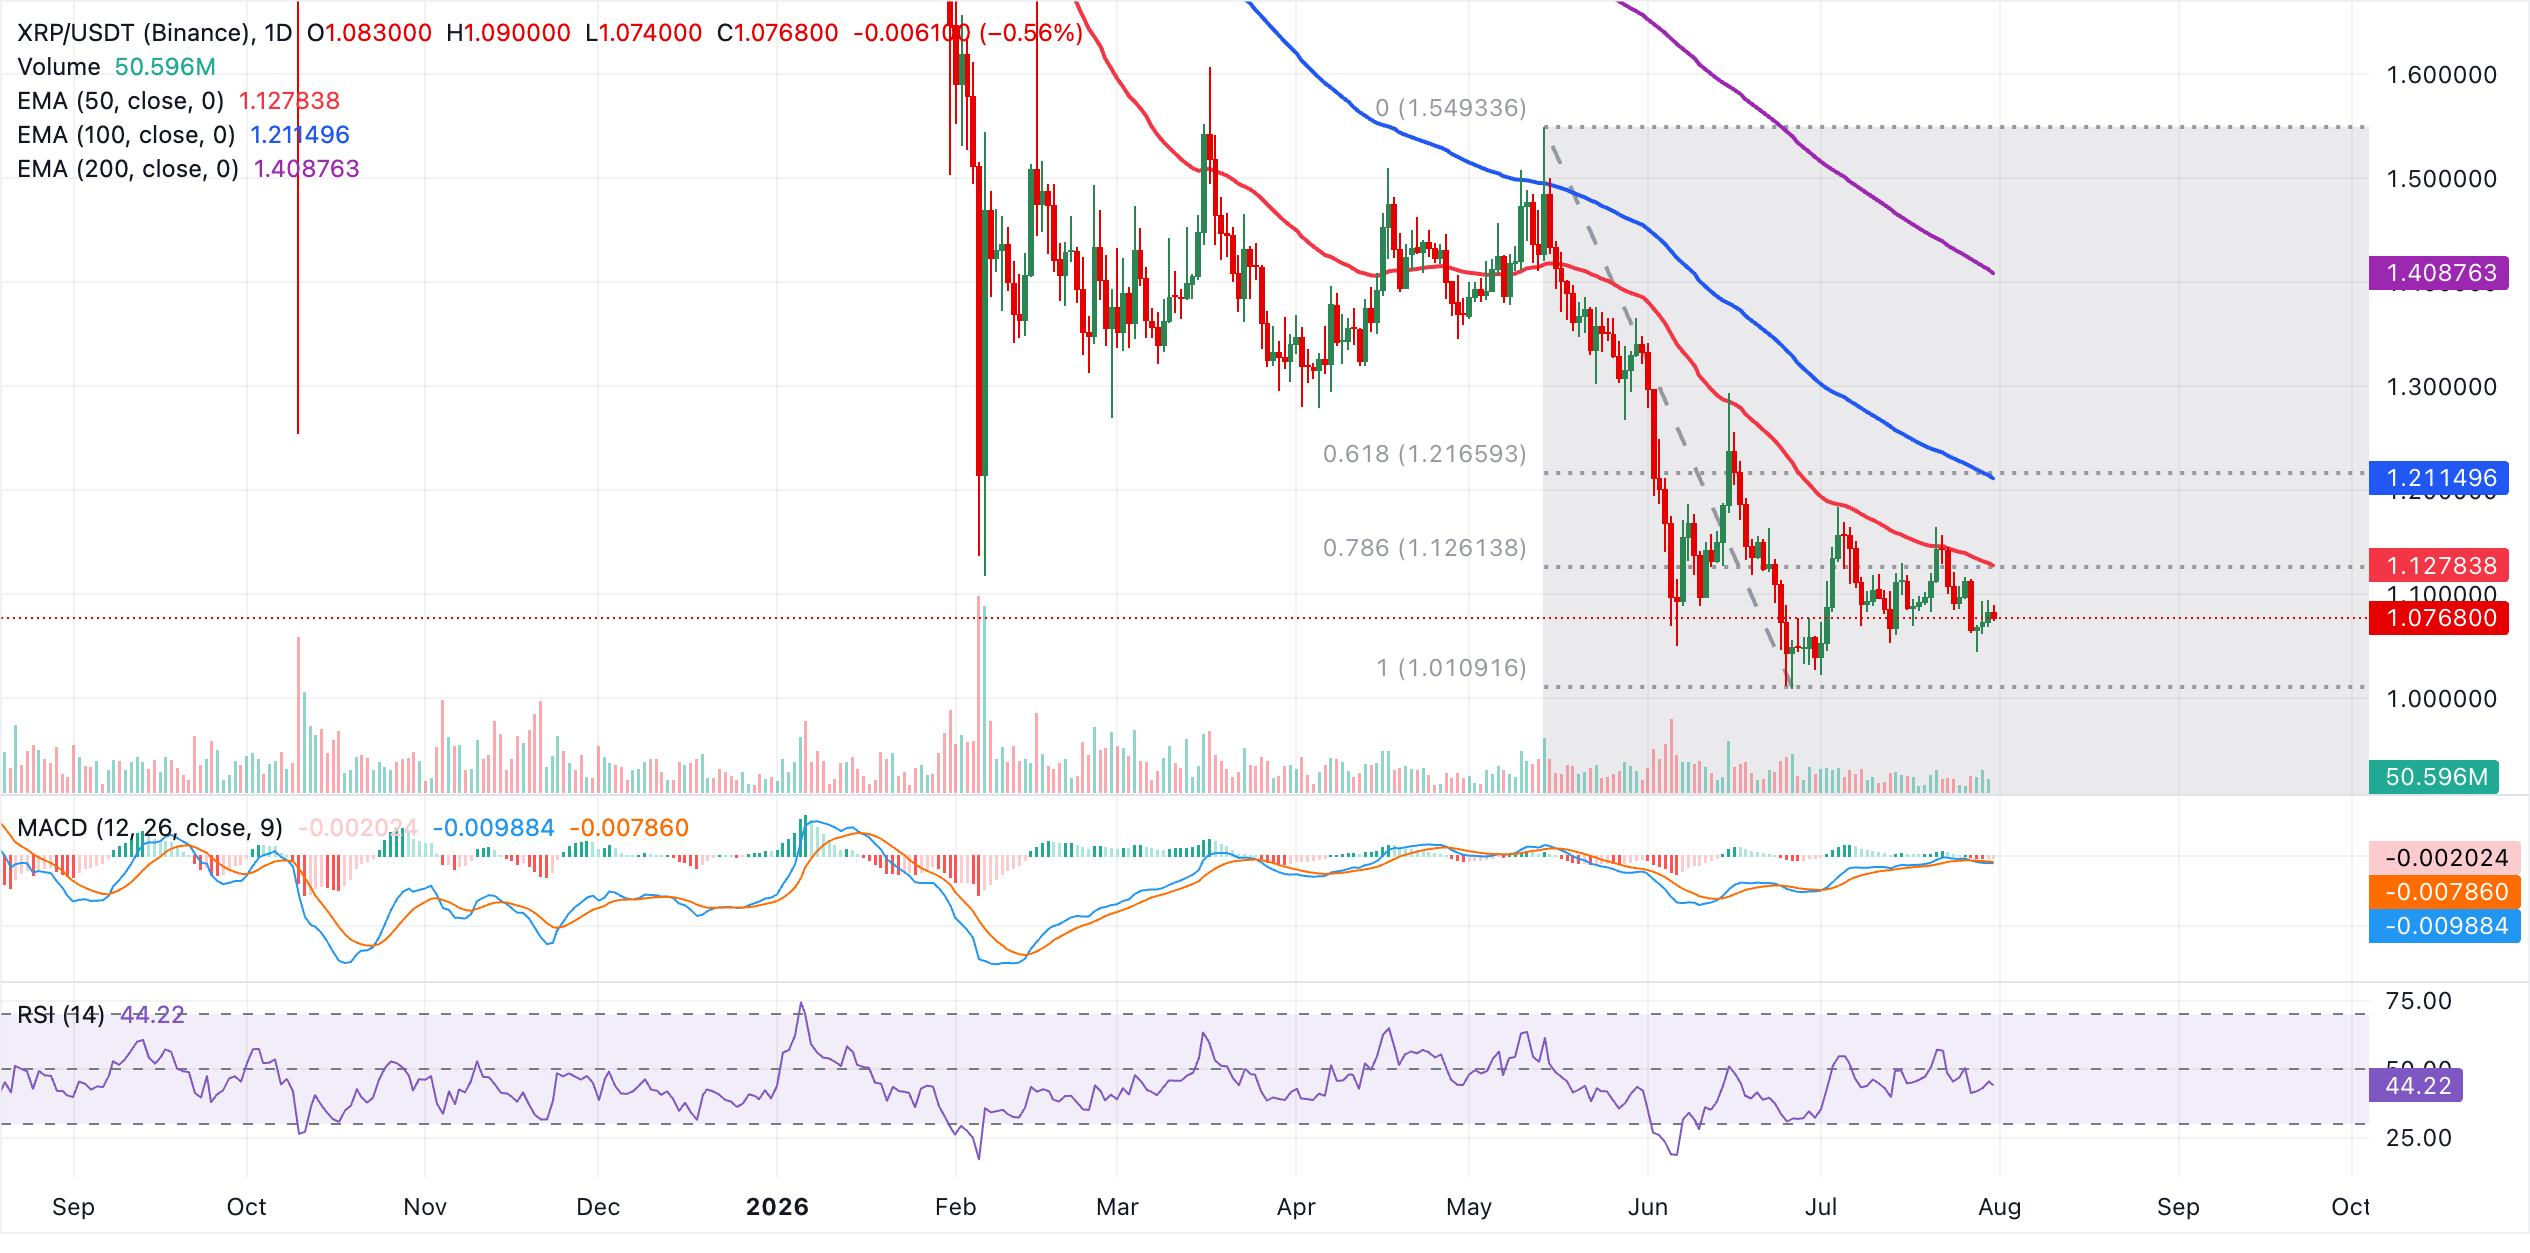
Initial resistance appears around the 78.6% Fibonacci retracement above $1.12, closely followed by the 50-day EMA at $1.13, forming a nearby supply band. Above that, the 100-day EMA at $1.21 and the 61.8% Fibonacci retracement at $1.22 mark the next hurdles before the broader Fibonacci barriers at $1.28 and $1.34. The 200-day EMA at $1.41 and the 23.6% Fibonacci retracement at $ 1.42 reinforce a higher-term cap.
On the downside, the main structural support is seen at the 100.0% Fibonacci level near $1.01, where buyers may look to defend the prior swing low if the current decline extends.
(The technical analysis of this story was written with the help of an AI tool. Know more.)
Crypto ETF FAQs
An Exchange-Traded Fund (ETF) is an investment vehicle or an index that tracks the price of an underlying asset. ETFs can not only track a single asset, but a group of assets and sectors. For example, a Bitcoin ETF tracks Bitcoin’s price. ETF is a tool used by investors to gain exposure to a certain asset.
Yes. The first Bitcoin futures ETF in the US was approved by the US Securities & Exchange Commission in October 2021. A total of seven Bitcoin futures ETFs have been approved, with more than 20 still waiting for the regulator’s permission. The SEC says that the cryptocurrency industry is new and subject to manipulation, which is why it has been delaying crypto-related futures ETFs for the last few years.
Yes. The SEC approved in January 2024 the listing and trading of several Bitcoin spot Exchange-Traded Funds, opening the door to institutional capital and mainstream investors to trade the main crypto currency. The decision was hailed by the industry as a game changer.
The main advantage of crypto ETFs is the possibility of gaining exposure to a cryptocurrency without ownership, reducing the risk and cost of holding the asset. Other pros are a lower learning curve and higher security for investors since ETFs take charge of securing the underlying asset holdings. As for the main drawbacks, the main one is that as an investor you can’t have direct ownership of the asset, or, as they say in crypto, “not your keys, not your coins.” Other disadvantages are higher costs associated with holding crypto since ETFs charge fees for active management. Finally, even though investing in ETFs reduces the risk of holding an asset, price swings in the underlying cryptocurrency are likely to be reflected in the investment vehicle too.
Recommended Articles











Comments (0)
Click the $ button, enter the symbol, and select to link a stock, ETF, or other ticker.