


Ethereum Records Massive Exchange Outflow Across Major Exchanges – Demand Recovering?



Ethereum has reclaimed the $1,650 level after the most significant drop of recent weeks carried the price to approximately $1,520 — a low that tested the structural conviction of holders across every category and time horizon. The recovery is tentative but real — and CryptoQuant data has identified a development in the exchange reserve data that occurred during and immediately after the drop that changes how the current bounce should be interpreted.
Between June 4 and June 7, Ethereum exchange reserves across four major platforms declined by approximately 475,000 ETH in a synchronized move that was not isolated to any single venue. Binance reserves fell from 3.87 million ETH to 3.68 million ETH — a reduction of approximately 190,000 ETH. Bitfinex declined from 2.67 million ETH to 2.49 million ETH, shedding another 180,000 ETH over the same window. OKX recorded the sharpest percentage decline, with reserves falling from 424,000 ETH to 340,000 ETH between June 4 and June 7 — a drop of nearly 20% in three days. Gemini added to the picture, declining from 541,000 ETH to 520,000 ETH between June 5 and June 7.

Four exchanges. Four simultaneous reserve declines. A combined 475,000 ETH leaving exchange custody during the exact period that the price was testing its lowest levels. The synchronization is the signal — and what it describes about who was active at $1,520 is the most important analytical question the CryptoQuant data raises.
475000 ETH Left Four Exchanges in Three Days
The CryptoQuant analysis identifies synchronization as the element that elevates individual exchange declines into a market structure signal. A single exchange reducing reserves during a price drop can reflect routine portfolio management, custody migration, or any number of operational decisions specific to that venue. Four exchanges declining simultaneously — Binance, OKX, Bitfinex, and Gemini — across the same three-day window while Ethereum was testing its lowest levels points toward something more deliberate and more directional.
The combined 475,000 ETH reduction tightens the available liquidity on centralized platforms at precisely the moment the price was creating the conditions that historically attract accumulation. Whether the withdrawals reflect coordinated institutional positioning, individual large holders independently reaching the same conclusion about the $1,520 level, or a combination of both, the aggregate effect on exchange supply is identical — less ETH immediately available for sale on the venues where most spot trading occurs.
June 7 emerges from the analysis as a key structural date. The reserve declines concentrated around that window create a before-and-after reference point for tracking whether the tightening continues or reverses as Ethereum attempts to hold the $1,650 recovery.
The honest framing the analysis preserves matters. This is not an automatic bullish signal — reserve declines require strengthening demand to convert supply tightness into price appreciation. If ETH reserves continue falling while spot demand improves, Ethereum enters a thinner exchange liquidity environment where the same buying pressure produces larger price responses than it would against a fully stocked order book. That combination has not yet been confirmed. But the structural foundation for it was quietly assembled between June 4 and June 7.
Ethereum Attempts Recovery After Historic Support Breakdown
Ethereum is attempting to stabilize above $1,650 after suffering one of its sharpest declines of the year. The daily chart shows ETH rebounding from a local low near $1,520, but the broader technical structure remains decisively bearish. Most importantly, Ethereum has now broken below the February support zone around $1,800–$1,900, a level that acted as a major floor throughout the last four months.
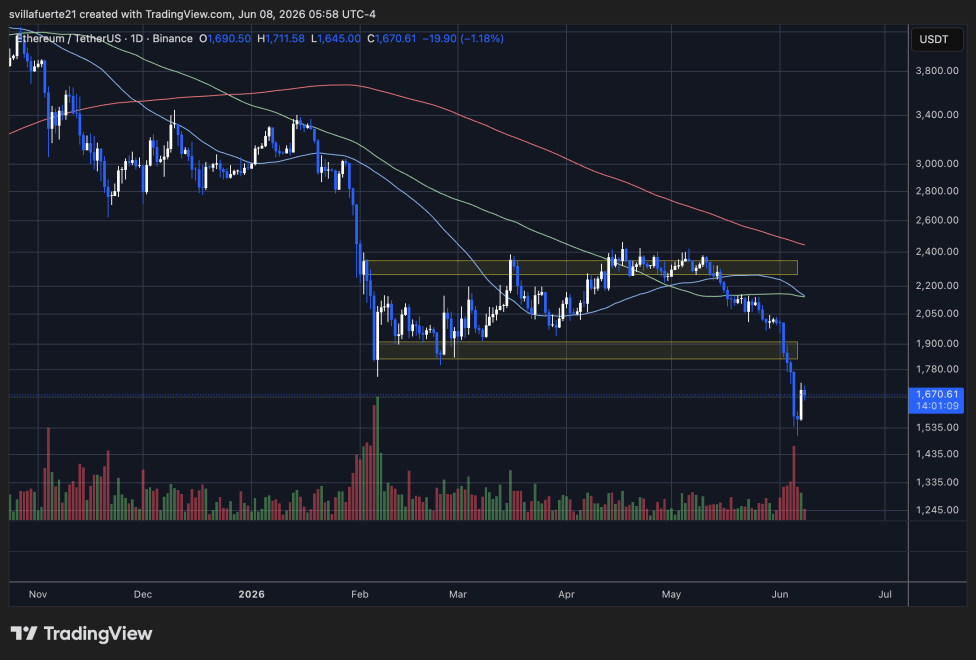
The significance of this breakdown cannot be overstated. The February low marked the capitulation event that established the base for the subsequent recovery toward $2,400. By falling below that level, ETH has invalidated a key support structure and entered price territory not seen since the first quarter of the year.
Volume surged aggressively during the selloff, confirming strong participation from sellers rather than a low-liquidity decline. However, the current bounce is occurring alongside a noticeable reduction in selling volume, suggesting that the most intense phase of the liquidation may be easing for now.
From a trend perspective, ETH remains below the 50-day, 100-day, and 200-day moving averages, all of which continue to slope downward. The first major resistance sits near $1,800, followed by the former support zone around $1,900. Until those levels are reclaimed, the recovery remains a relief rally within a larger downtrend.
Featured image from ChatGPT, chart from TradingView.com
Recommended Articles









Comments (0)
Click the $ button, enter the symbol, and select to link a stock, ETF, or other ticker.