


Bitcoin’s Longest-Running Bottom Signal Is Back In Focus: Capitulation Fears Grow



Bitcoin has lost the $69,000 level as selling pressure and market uncertainty combine to test the resilience of a market that has now given back a significant portion of its recovery from the cycle lows. The breakdown is uncomfortable — and analyst MorenoDV has identified a signal in the supply data that places the current moment in a long-term structural context that spans a decade of Bitcoin market cycles.
Bitcoin’s Supply in Loss currently sits at 40.6% — meaning more than four in ten units of Bitcoin’s circulating value are held by participants whose cost basis is above the current price. The metric measures the share of circulating supply that is underwater at any given moment, and its current reading reflects the pain that the correction from the cycle highs has distributed across the holder base.
But the raw percentage is not the most important element of what MorenoDV’s analysis reveals. The real story is the long-term pattern behind the metric’s peaks — a structural observation that requires looking at the entire history of Bitcoin’s major cycle bottoms rather than any single reading in isolation.
Since 2015, every major Bitcoin cycle low has occurred when Supply in Loss pushed into the upper band of a descending trendline. And crucially, each successive cycle bottom has required a lower percentage of supply in loss than the one before it — a pattern of diminishing pain at successive lows that describes how Bitcoin’s market structure has evolved as the asset has matured and its holder base has deepened.
Each Cycle Bottom Needed Less Pain Than the Last
The MorenoDV analysis traces the descending loss threshold across Bitcoin’s entire modern market history to reveal the structural evolution that makes the current 40.6% reading more significant than the raw number suggests.
Early Bitcoin cycles required extreme pain to form genuine bottoms — more than 60% of the circulating supply underwater before capitulation created the conditions for recovery. The 2018 to 2019 and 2020 to 2022 cycle lows formed with progressively lower loss thresholds as the holder base matured and conviction deepened. The same structural trendline now sits closer to the high-40% area — reflecting a market where ETFs, institutions, long-term holders, and high-conviction participants have replaced the weaker hands that previously needed to be fully exhausted before bottoms could form.

The current 40.6% reading places Bitcoin in meaningful stress territory without yet reaching the historical maximum opportunity zone. A continuation of weakness or extended consolidation that pushes Supply in Loss into a retest of the descending trendline would place the market in a region that has repeatedly marked significant accumulation windows across a decade of cycles.
The psychological mechanism behind the signal is what gives it its forward relevance. Rising supply in loss moves markets from optimism to doubt and from doubt to forced patience — the sequence that exhausts reactive sellers and creates the conditions where long-term capital begins absorbing supply at scale.
Bottoms do not form immediately when this zone is reached. Historical precedent includes volatility, false breakdowns, and emotional exhaustion before recovery begins. But from a risk and reward perspective, a retest of this decade-long structure represents one of the most important signals Bitcoin can generate — and MorenoDV’s analysis suggests the market is approaching rather than departing from that territory.
Bitcoin Loses Major Weekly Support As Bears Target Lower Demand ZoneBitcoin is trading near $69,600 on the weekly timeframe after losing the critical $72,000–$75,000 support region that had acted as the foundation of the recovery rally from the March lows. The breakdown is technically important because this zone served as both resistance and support during the past three months, making its loss a clear deterioration in market structure.
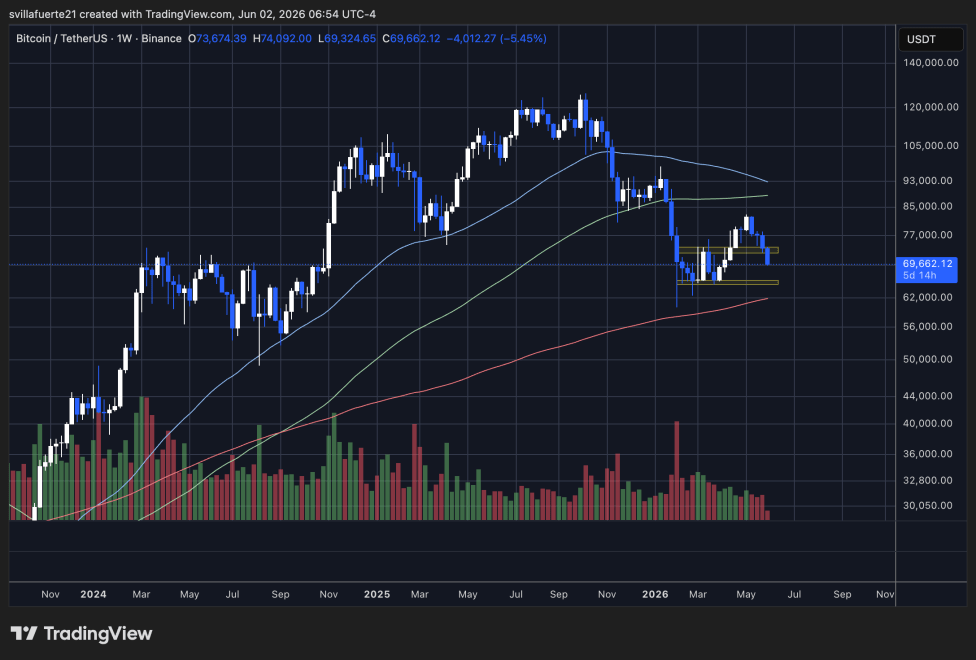
The weekly chart shows BTC rejecting from the $82,000 area before reversing sharply lower. That rejection established a lower high relative to the cycle peak near $123,000 and reinforced the broader downtrend that has been in place since late 2025. More concerning for bulls, the price has now fallen below the 50-week and 100-week moving averages, both of which are beginning to flatten after months of weakness.
From a structural perspective, the next major support sits between $64,000 and $66,000, highlighted by the lower yellow zone on the chart. This area acted as a key accumulation range following February’s capitulation event and represents the most important demand zone on the weekly timeframe.
For Bitcoin to stabilize, bulls must quickly reclaim the lost $72,000–$75,000 range. Until that happens, the path of least resistance remains lower, with the market increasingly focused on whether the $64,000–$66,000 region can provide the foundation for a durable bottom.
Featured image from ChatGPT, chart from TradingView.com
Recommended Articles









Comments (0)
Click the $ button, enter the symbol, and select to link a stock, ETF, or other ticker.