


Hyperliquid Price Forecast: Institutional demand, buybacks fuel the HYPE



- Hyperliquid hovers above $60 on Monday after a 7% jump the previous day, hitting a record high of $64.48.
- Institutional demand for the DEX token is scaling up, with $72 million in inflows last week.
- Buybacks and steady retail demand support the price discovery rally.
Hyperliquid (HYPE) is trading at an all-time high level at press time on Monday, driven by institutional and retail demand for the Decentralized Exchange (DEX). The revenue-linked HYPE token buyback supports the rally into a price discovery mode. The technical outlook is bullish, projecting a potential rise toward $80.
Bullish factors are fueling HYPE
Hyperliquid's rally amid volatile market conditions is linked to its emergence as an everything exchange platform, offering crypto, real-world commodities, and a prediction market.
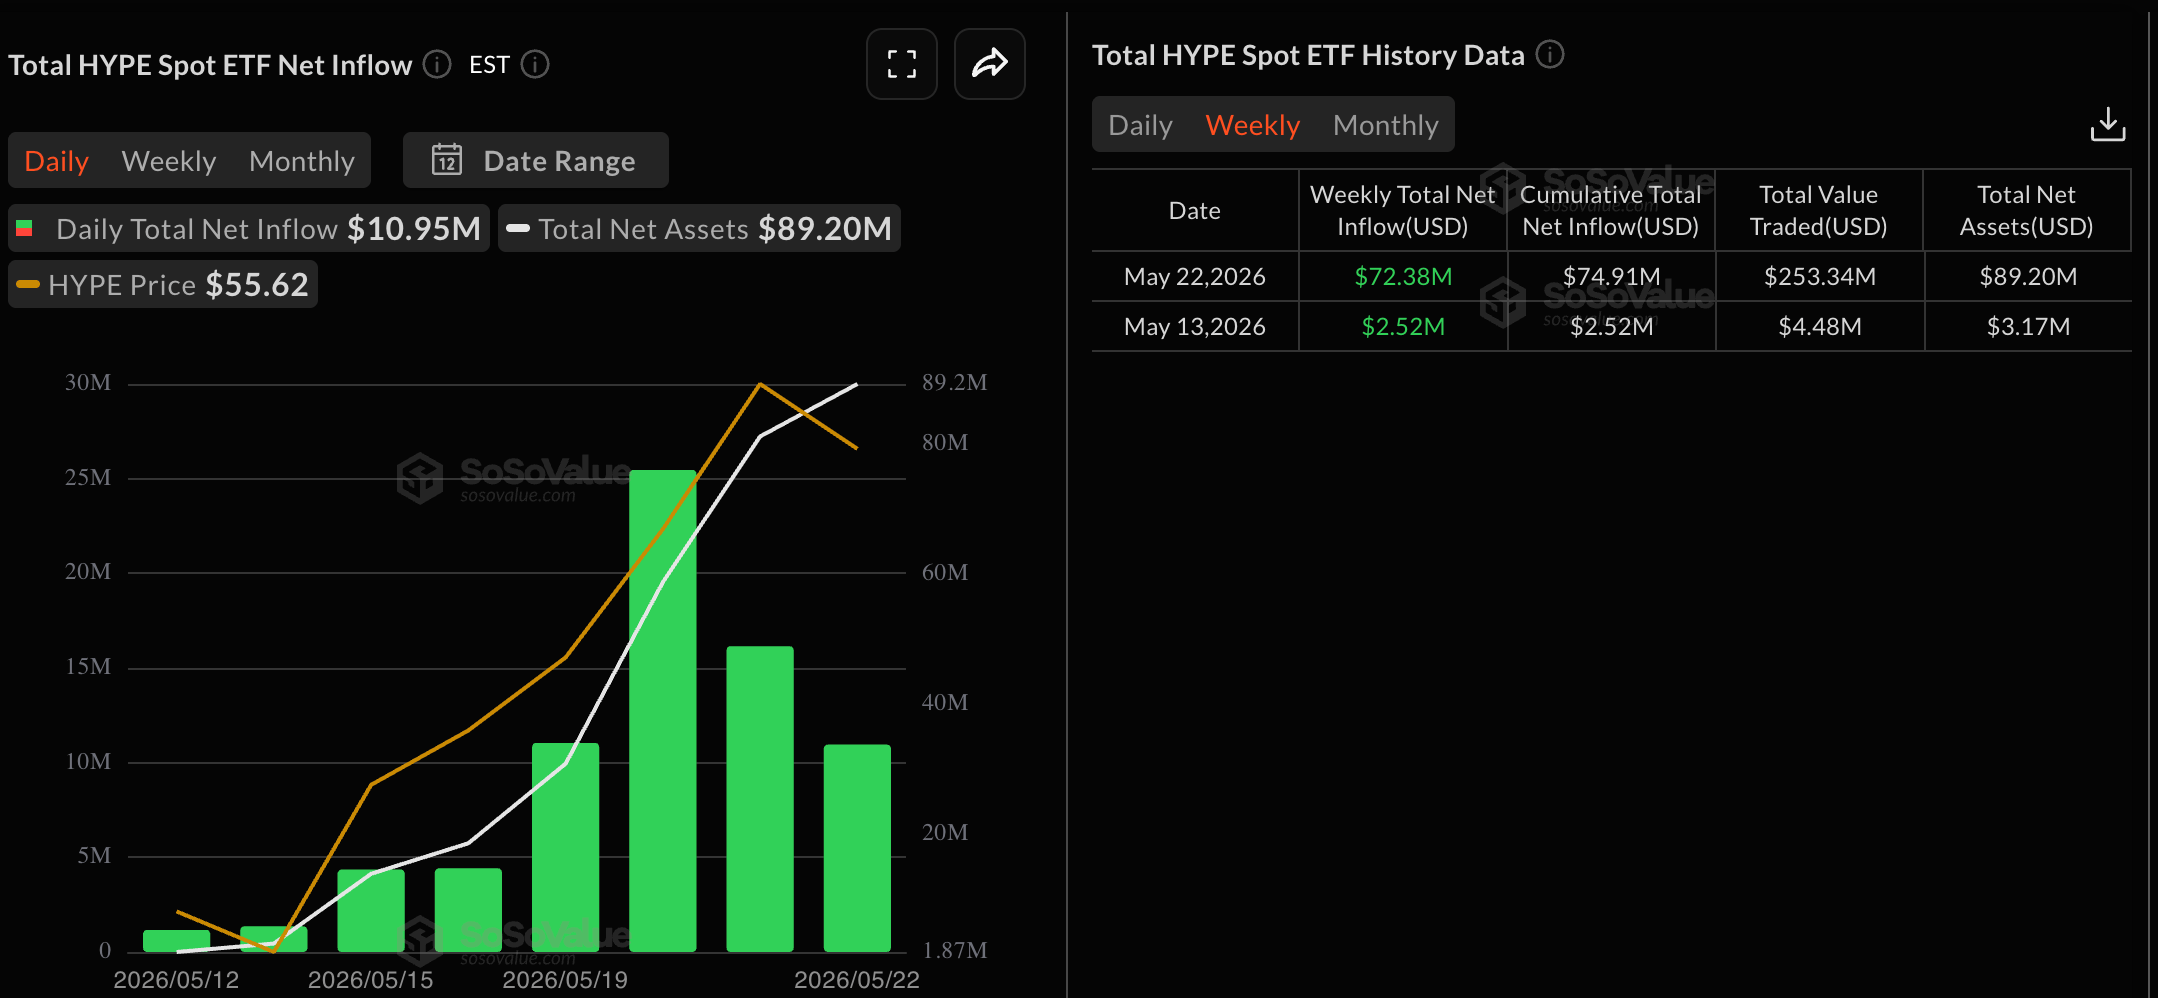
Data shows the launch of HYPE-focused ETFs by 21Shares and Bitwise recorded $72.38 million in inflows last week, building on the $2.52 million in inflows the previous week. Typically, a surge in institutional activity boosts retail demand and spot price.
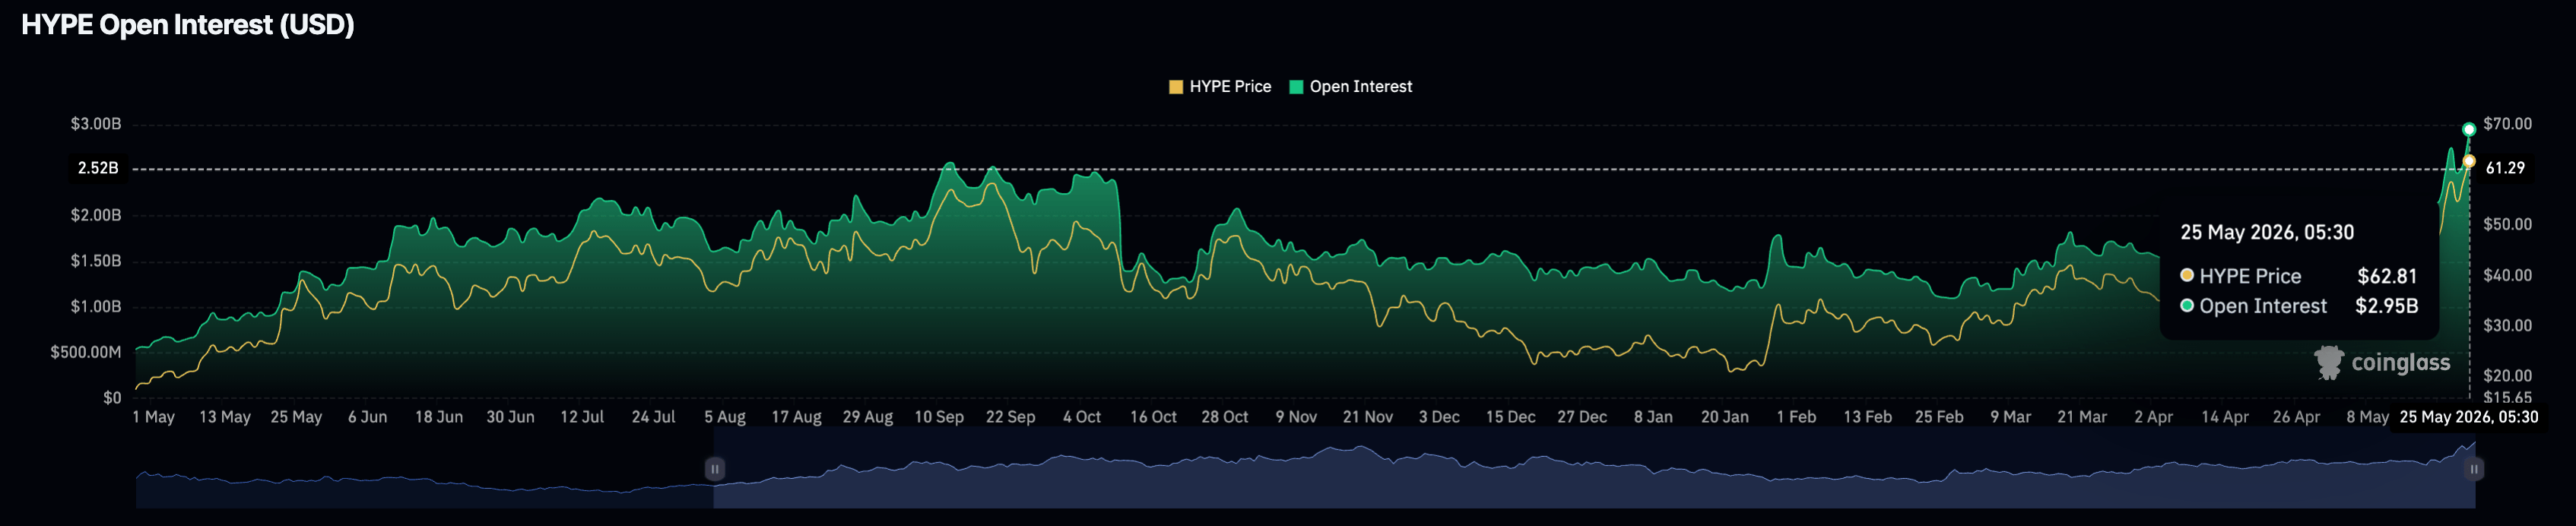
CoinGlass data confirms a rise in retail activity, with HYPE futures Open Interest (OI) hitting a record high of $2.95 billion on Monday, indicating a positional buildup driving the notional value of outstanding contracts to unprecedented levels.
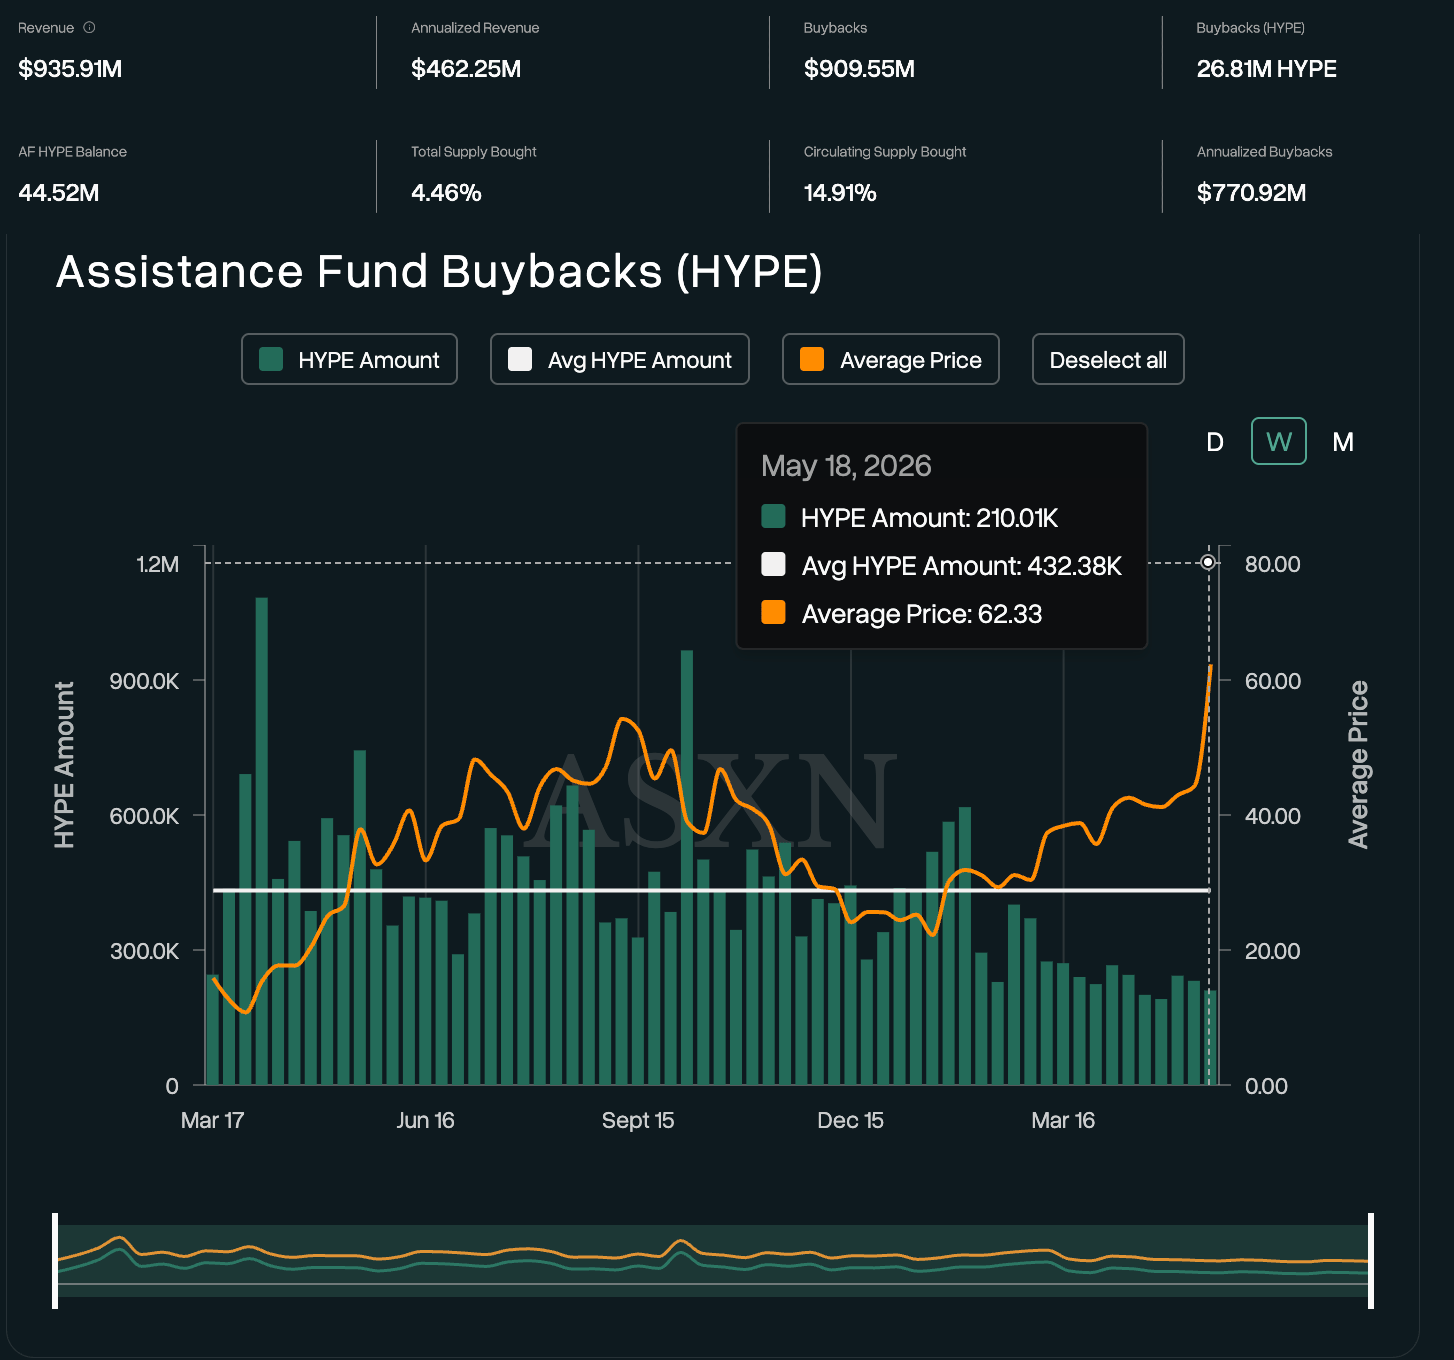
On the other hand, Hyperliquid redirects 97% to 99% of its trading fees to buy back HYPE tokens, locked in its assistance fund. Hyperscreener data shows roughly 210,000 HYPE tokens were bought back last week, effectively removing them from circulation. The assistance fund holds 44.52 million HYPE tokens, including the total buyback of 26.81 million HYPE.
Will Hyperliquid price hit $80?
Hyperliquid is trading at an all-time high, extending a strong bullish phase above the 50- and 100-day Exponential Moving Averages (EMAs) at $45.07 and $40.98, as well as the 200-day EMA at $37.87. The pair has decisively broken above its previous swing high of $59.45, with a 7% rise on Sunday.
The Relative Strength Index (RSI) at 75 on the daily chart suggests overbought conditions, while the positive Moving Average Convergence Divergence (MACD) and its signal line scale up, hinting at a firm upside momentum in the near-term.
Hyperliquid's next key resistances align with the 127.2% and 161.8% Fibonacci extension levels at $70.04 and $83.51, respectively.
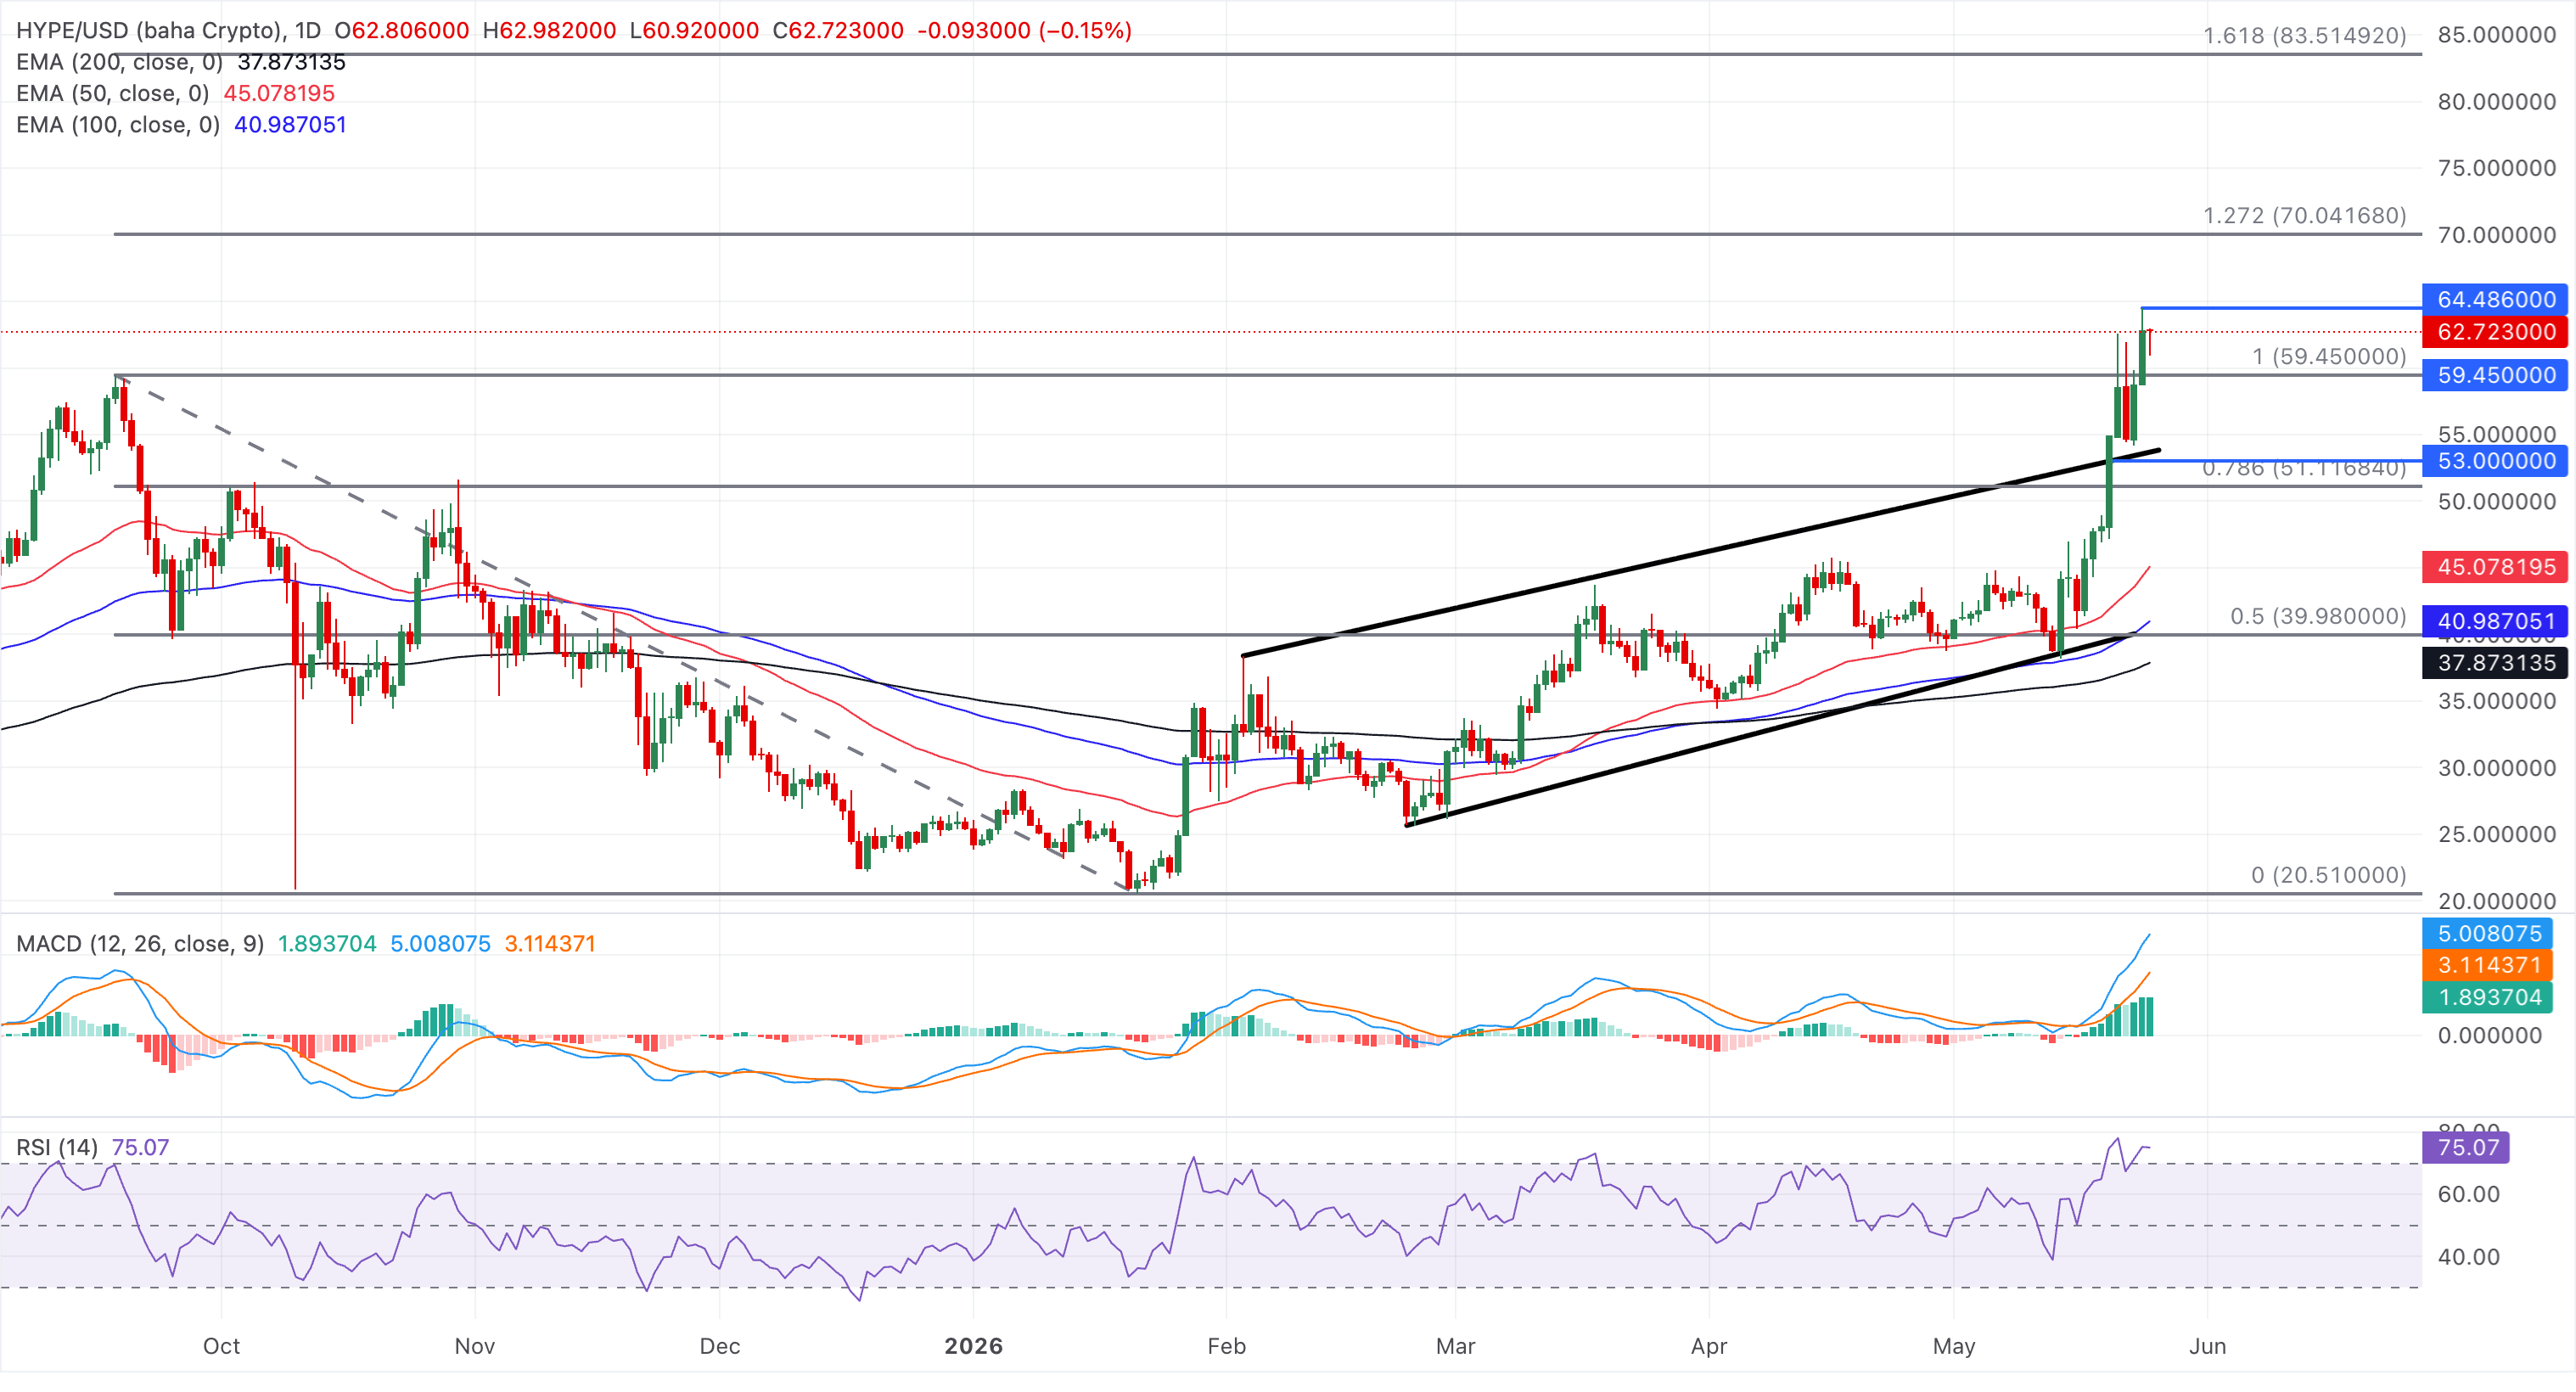
Looking down, the resistance-turned-support level at $59.45 acts as the immediate line of defense, followed by the $50.00 psychological level, which could serve as a secondary floor if a deeper pullback unfolds.
(The technical analysis of this story was written with the help of an AI tool.)
Recommended Articles








Comments (0)
Click the $ button, enter the symbol, and select to link a stock, ETF, or other ticker.