


Cardano Price Forecast: ADA loses bullish momentum as 100-day EMA caps recovery



- Cardano edges below $0.2800 on Tuesday, retracing after 4% gains the previous day.
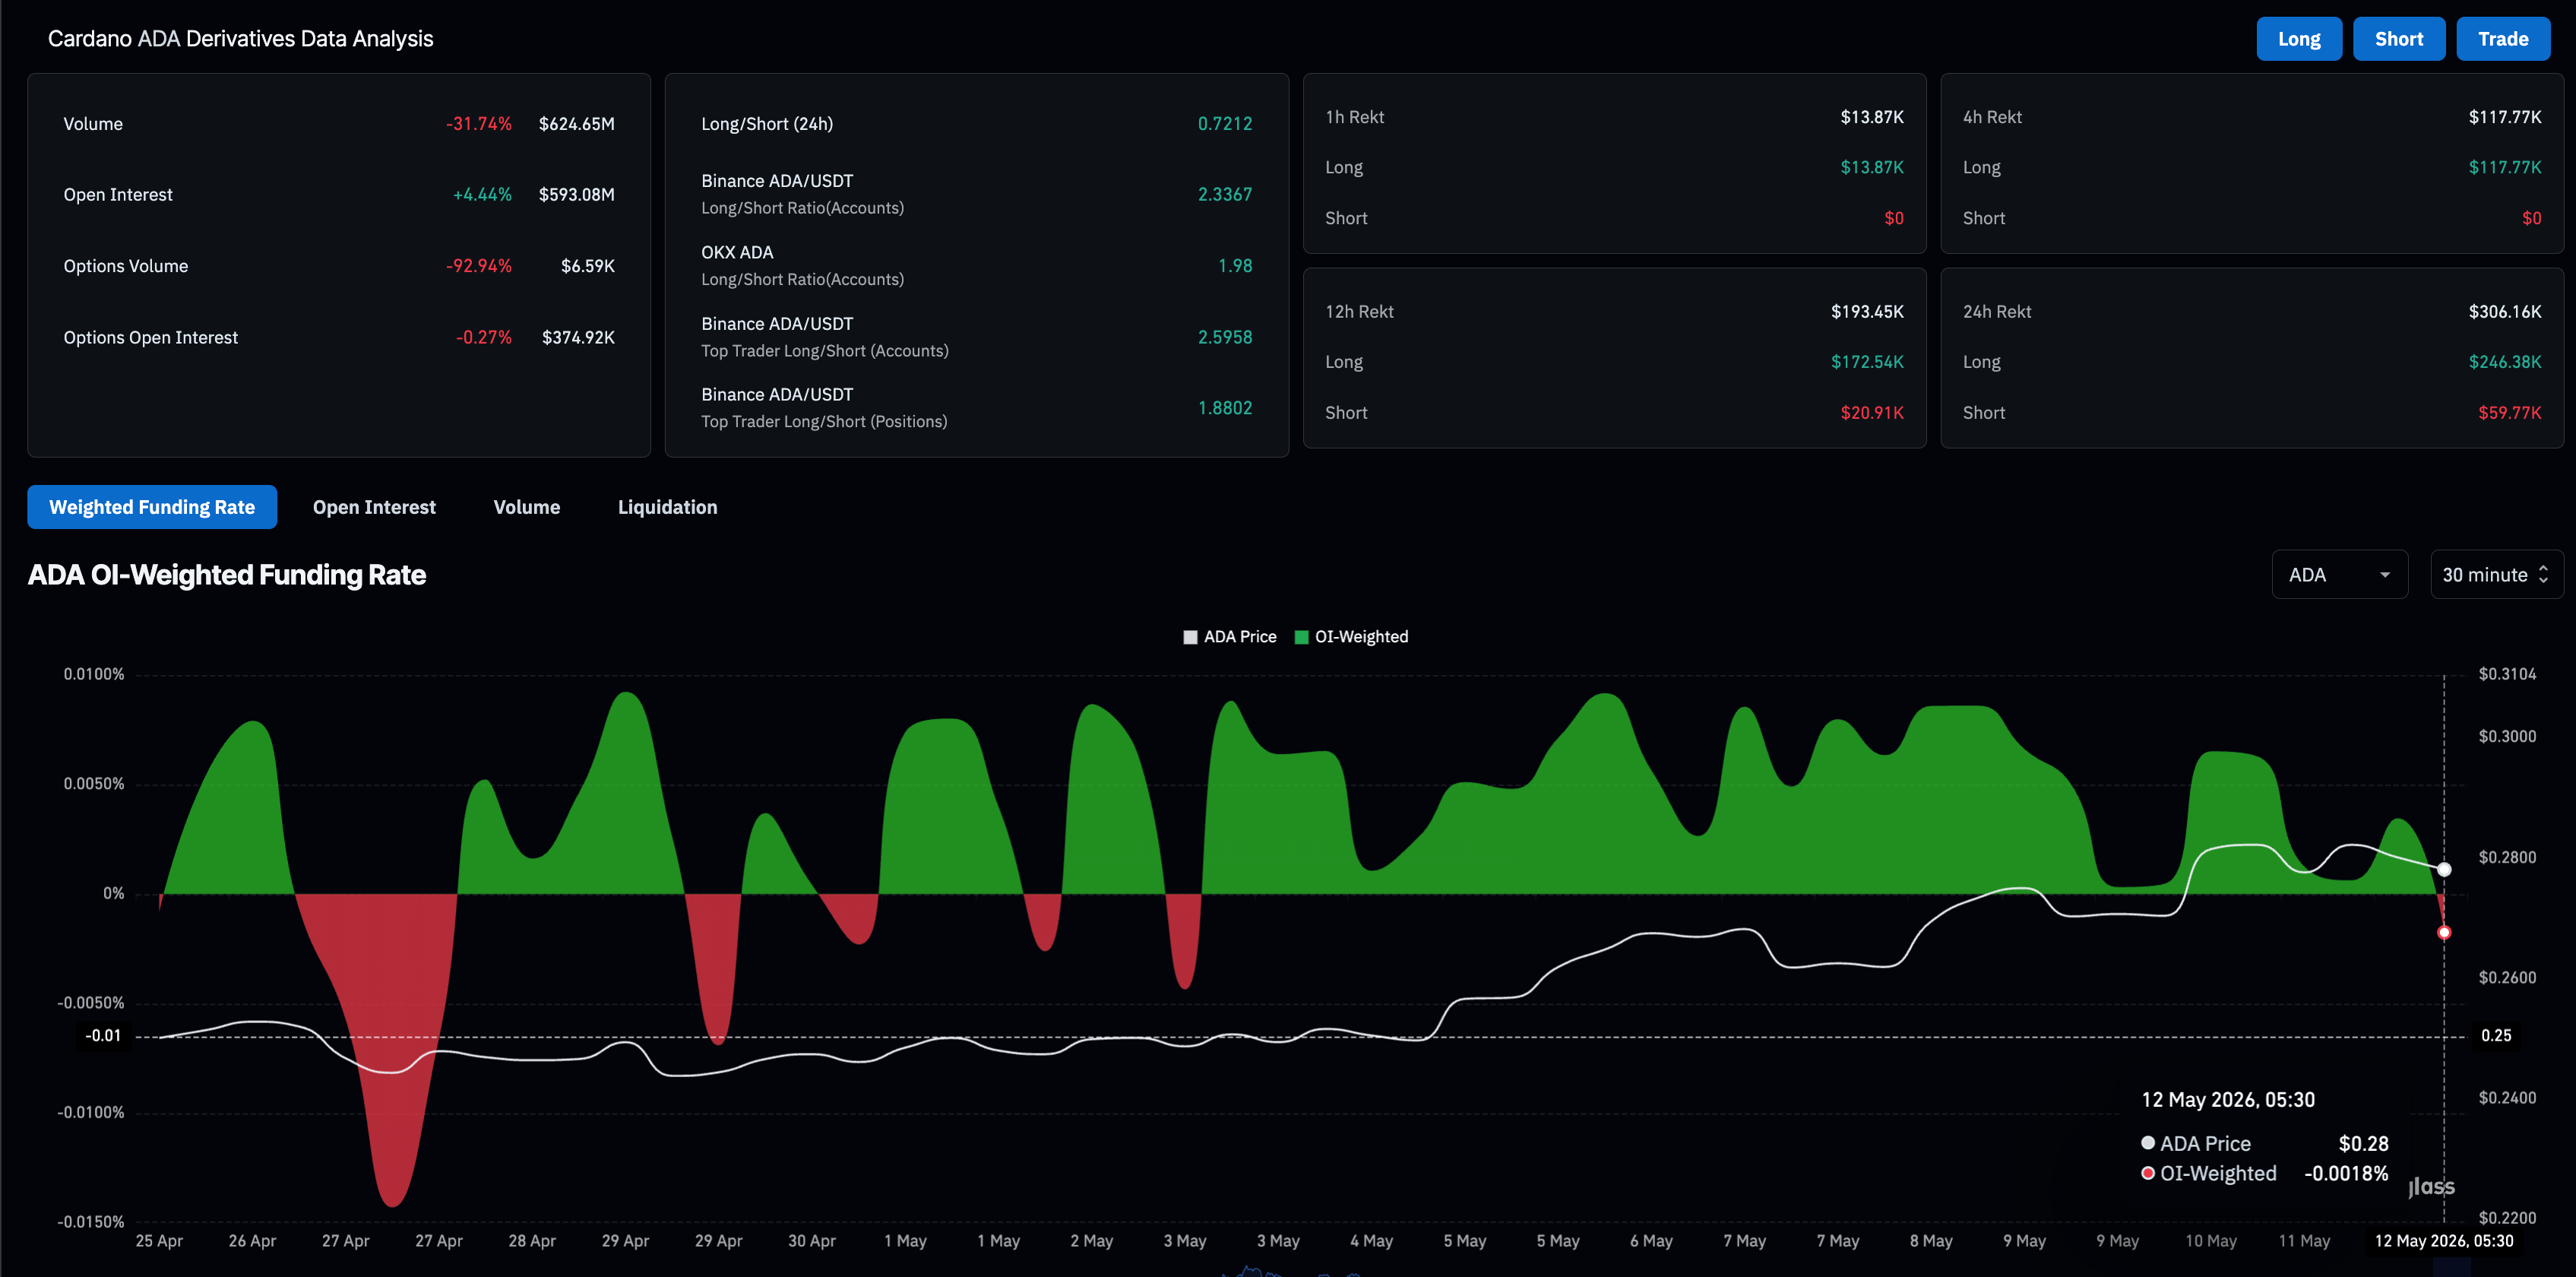
- Derivatives data shows a buildup in positions despite a reduction in bullish interest among traders.
- The path of least resistance targets the 50-day EMA at $0.2602 as the next key support level.
Cardano (ADA) extends losses below $0.2800 on Tuesday after the 100-day Exponential Moving Average capped Sunday’s 4% recovery. Retail demand is shifting bearish as positional buildup aligns with negative funding rates. The technical outlook for Cardano is cautiously bearish, targeting the 50-day EMA at $0.2602.
Cardano futures market activity turns bearish
Cardano futures market sentiment is shifting bearish amid a spot price pullback so far this week. CoinGlass data shows the ADA futures Open Interest (OI) is up over 4% in 24 hours to $593.08 million, indicating a buildup of positions as traders anticipate a sharp move. However, the negative funding rate of -0.0018% reflects a decline in traders' willingness to take long positions, suggesting a bearish setup.
At the same time, the long-to-short ratio of 0.7212 indicates that active short positions significantly outnumber long positions, reaffirming the bearish outlook.
Will Cardano hold above its 50-day EMA?
Cardano trades around $0.2781 at press time on Tuesday, maintaining a capped tone below its 100-day EMA at $0.2870. Still, ADA holds above the 50-day EMA at $0.2603, maintaining a short-term constructive bias.
The Moving Average Convergence Divergence (MACD) inches closer to the signal line as the positive histogram bars contract, while the Relative Strength Index (RSI) slips to 65, suggesting bullish momentum is squeezing after being overextended.
On the topside, immediate resistance is seen at the 100-day EMA near $0.2870, with the longer-term 200-day EMA around $0.3696 acting as the next significant barrier if buyers extend the recovery.
On the downside, the 50-day EMA at $0.2603 offers the first notable layer of support, and a daily close back below this level would hint that the latest rebound is fading and the broader bearish bias is reasserting itself.
(The technical analysis of this story was written with the help of an AI tool.)
Recommended Articles









Comments (0)
Click the $ button, enter the symbol, and select to link a stock, ETF, or other ticker.