


Meme Coins Price Prediction: Dogecoin flips bearish as Shiba Inu and Pepe consolidate



- Dogecoin extends losses for the third consecutive day, testing its 100-day EMA support at $0.1062.
- Shiba Inu extends its consolidation between the 50-day and 100-day EMAs on Friday amid overhead pressure.
- Pepe is holding steady above its 100-day EMA on Friday after a bullish start to the week.
Meme coins, including Dogecoin (DOGE), Shiba Inu (SHIB), and Pepe (PEPE), risk erasing earlier gains as buying pressure and broader market sentiment weaken.
Capped recovery flips Dogecoin bearish
Dogecoin trades around $0.1065 at press time on Friday, holding a neutral-to-bearish tone. The proximity of the meme coin price to the 100-day Exponential Moving Average (EMA) at $0.1063 suggests an ongoing test of this short-term floor, while trading well beneath the longer-term 200-day EMA at $0.1262.
The Moving Average Convergence Divergence (MACD) indicator remains marginally positive on the daily chart but is nearing its signal line, risking a bearish crossover. At the same time, the Relative Strength Index (RSI) around 57 hints at mildly constructive momentum rather than overbought conditions.
On the topside, the $0.1160 supply zone and the 200-day EMA at $0.1262 are the next significant resistances, and a daily close above it would be needed to argue for a stronger bullish trend extension.
On the downside, immediate support is aligned near the current pivot zone around $0.1064, reinforced by the 100-day EMA at $0.1063, with the 50-day EMA at $0.1005 offering a deeper but still important cushion should sellers regain traction.
Shiba Inu consolidates as downside pressure lingers
Shiba Inu is consolidating between its 50-day and 100-day EMAs at $0.00000614 and $0.00000644, respectively. At the time of writing, SHIB holds steady on Friday after a 2% decline the previous day.
The MACD and its signal line continue to move sideways, risking a bearish crossover, which would confirm a rise in selling pressure.
A daily close below the 50-day EMA at $0.00000614 could extend the decline toward the March 19 low at $0.00000562.
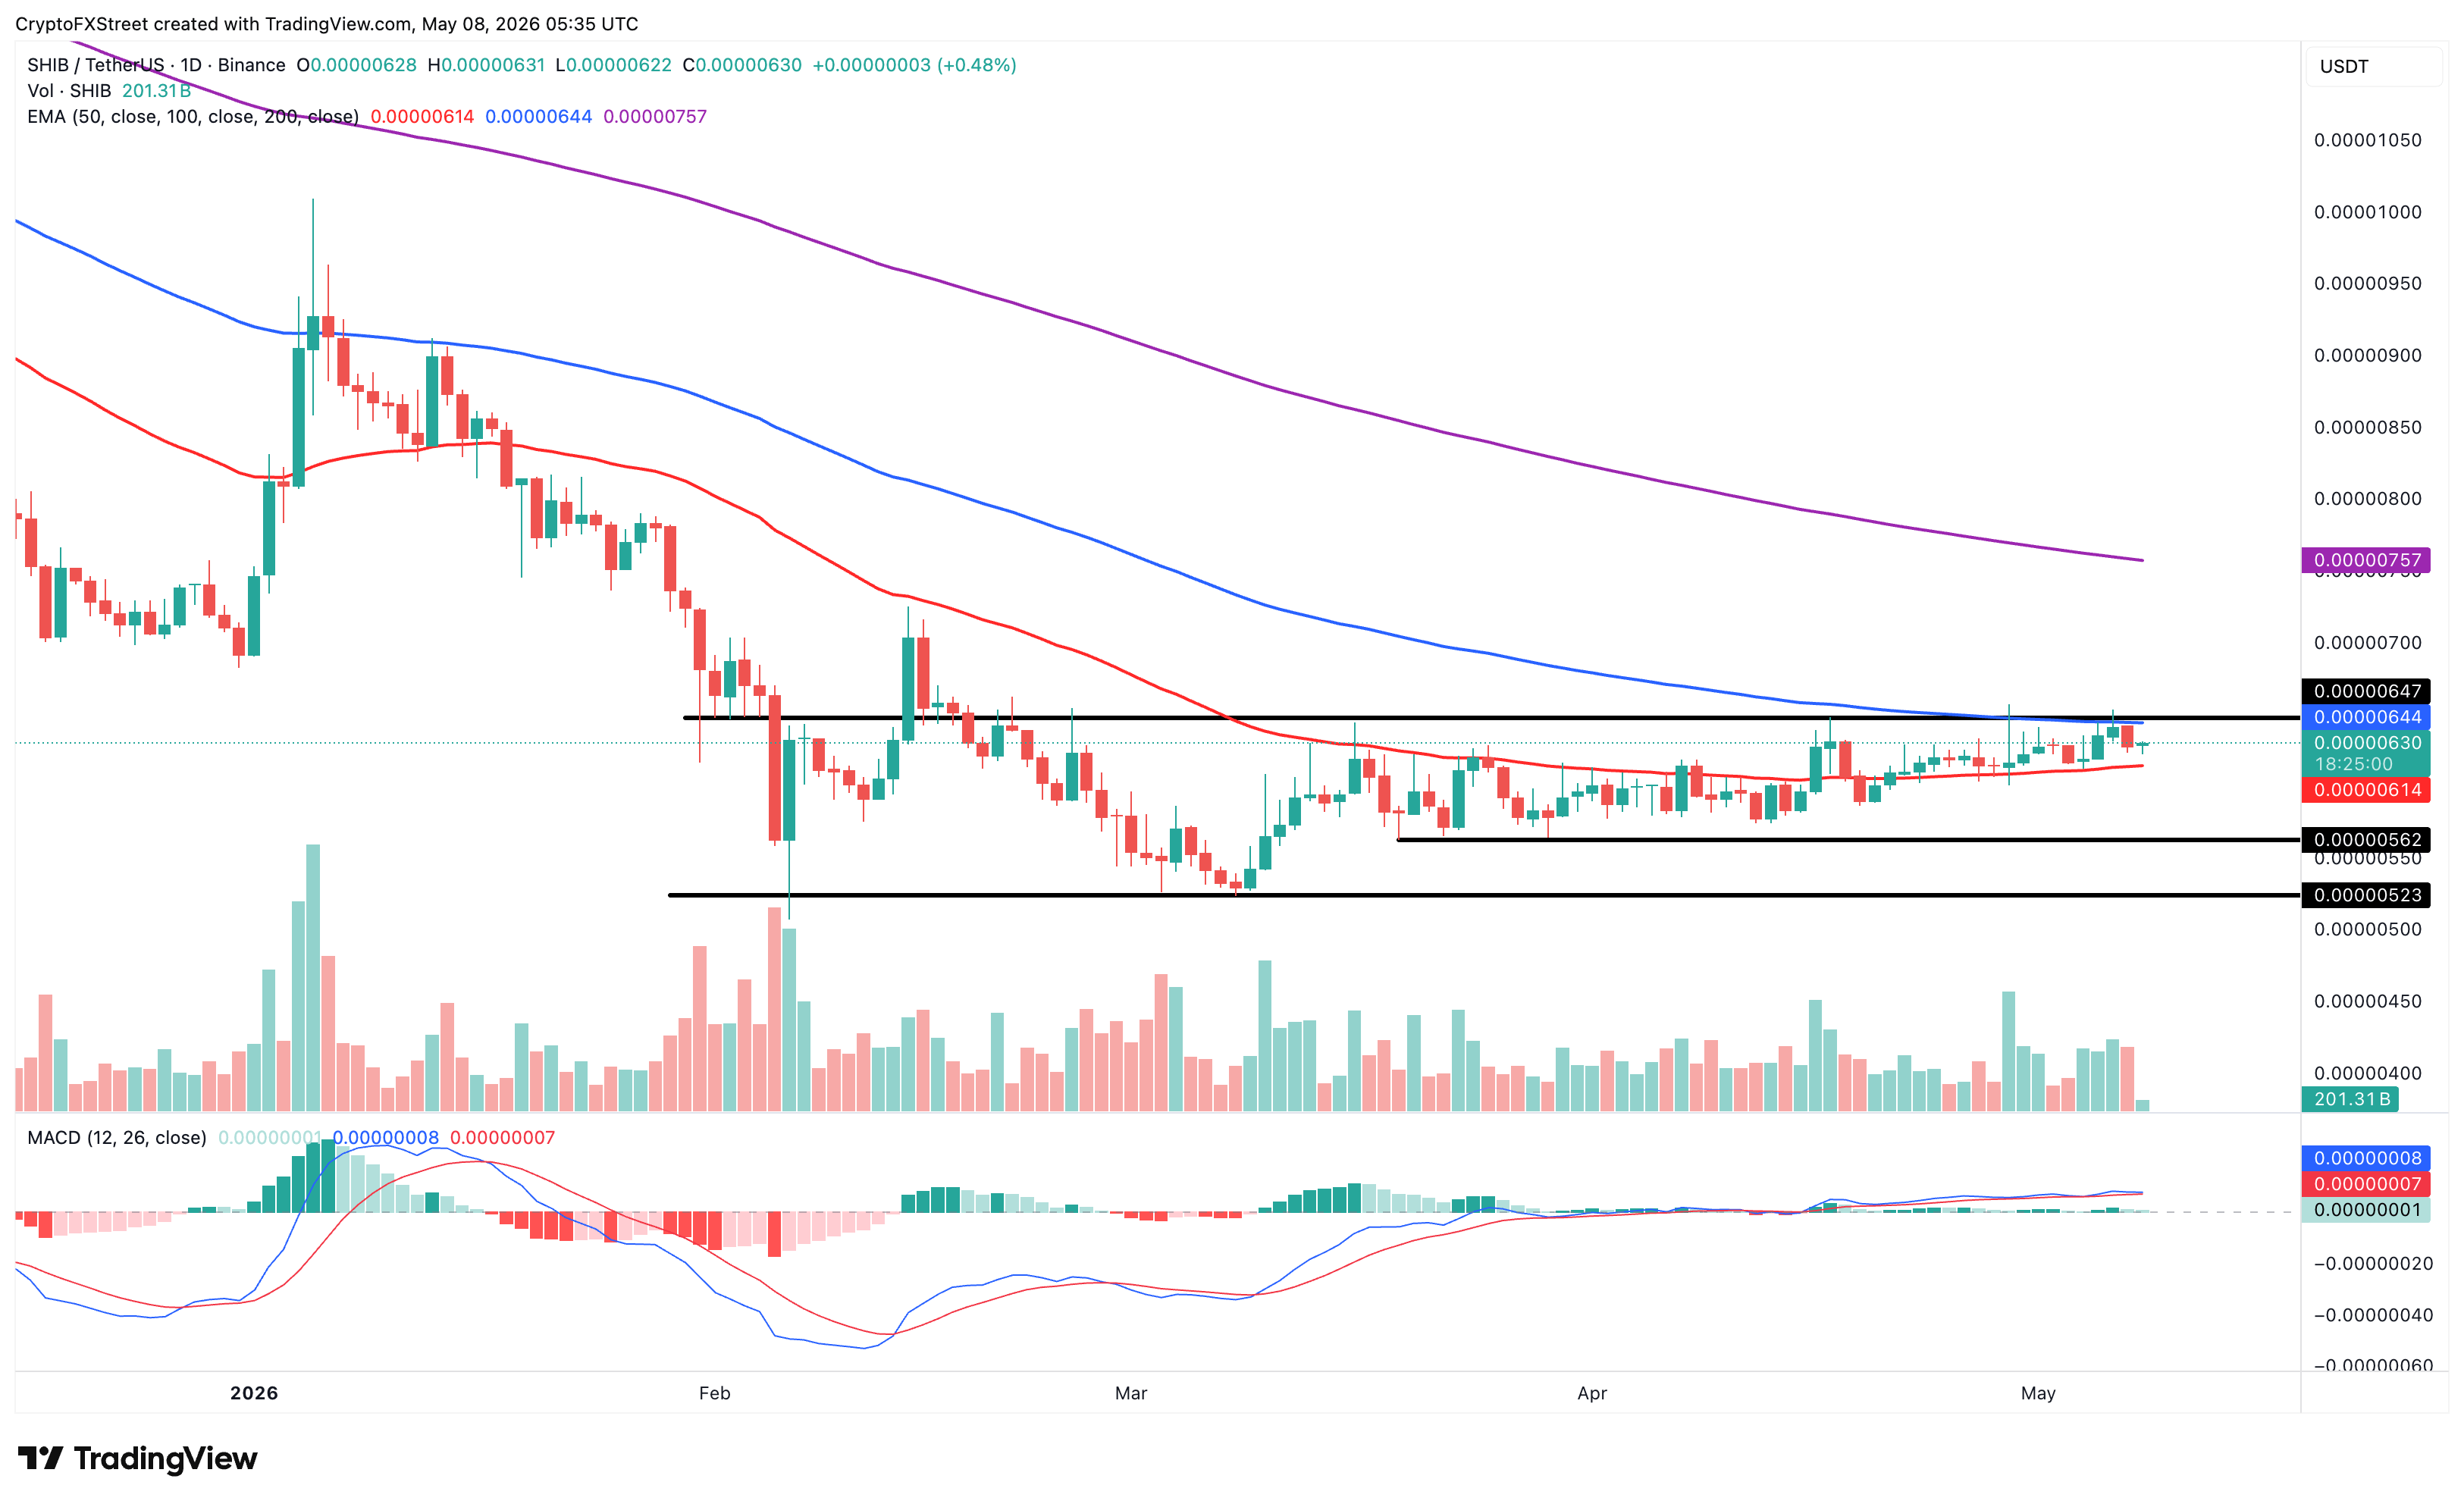
On the flip side, if SHIB clears the overhead 100-day EMA resistance at $0.00000644, bulls could target the 200-day EMA at $0.00000757.
Pepe holds above the 100-day EMA support
Pepe sits exactly above the clustered 50-day and 100-day EMAs, reflecting a mild bullish trend direction, while the overhead 200-day EMA maintains a larger bearish bias.
On the momentum side, the RSI at 64 leans toward bullish territory without signaling overbought conditions, while the MACD histogram shows contracting positive bars, hinting at a decreasing bullish momentum.
Looking up, the February 25 high at $0.00000443 and the 200-day EMA at $0.00000494, which is close to the $0.00000500 psychological threshold, serve as overhead resistance.
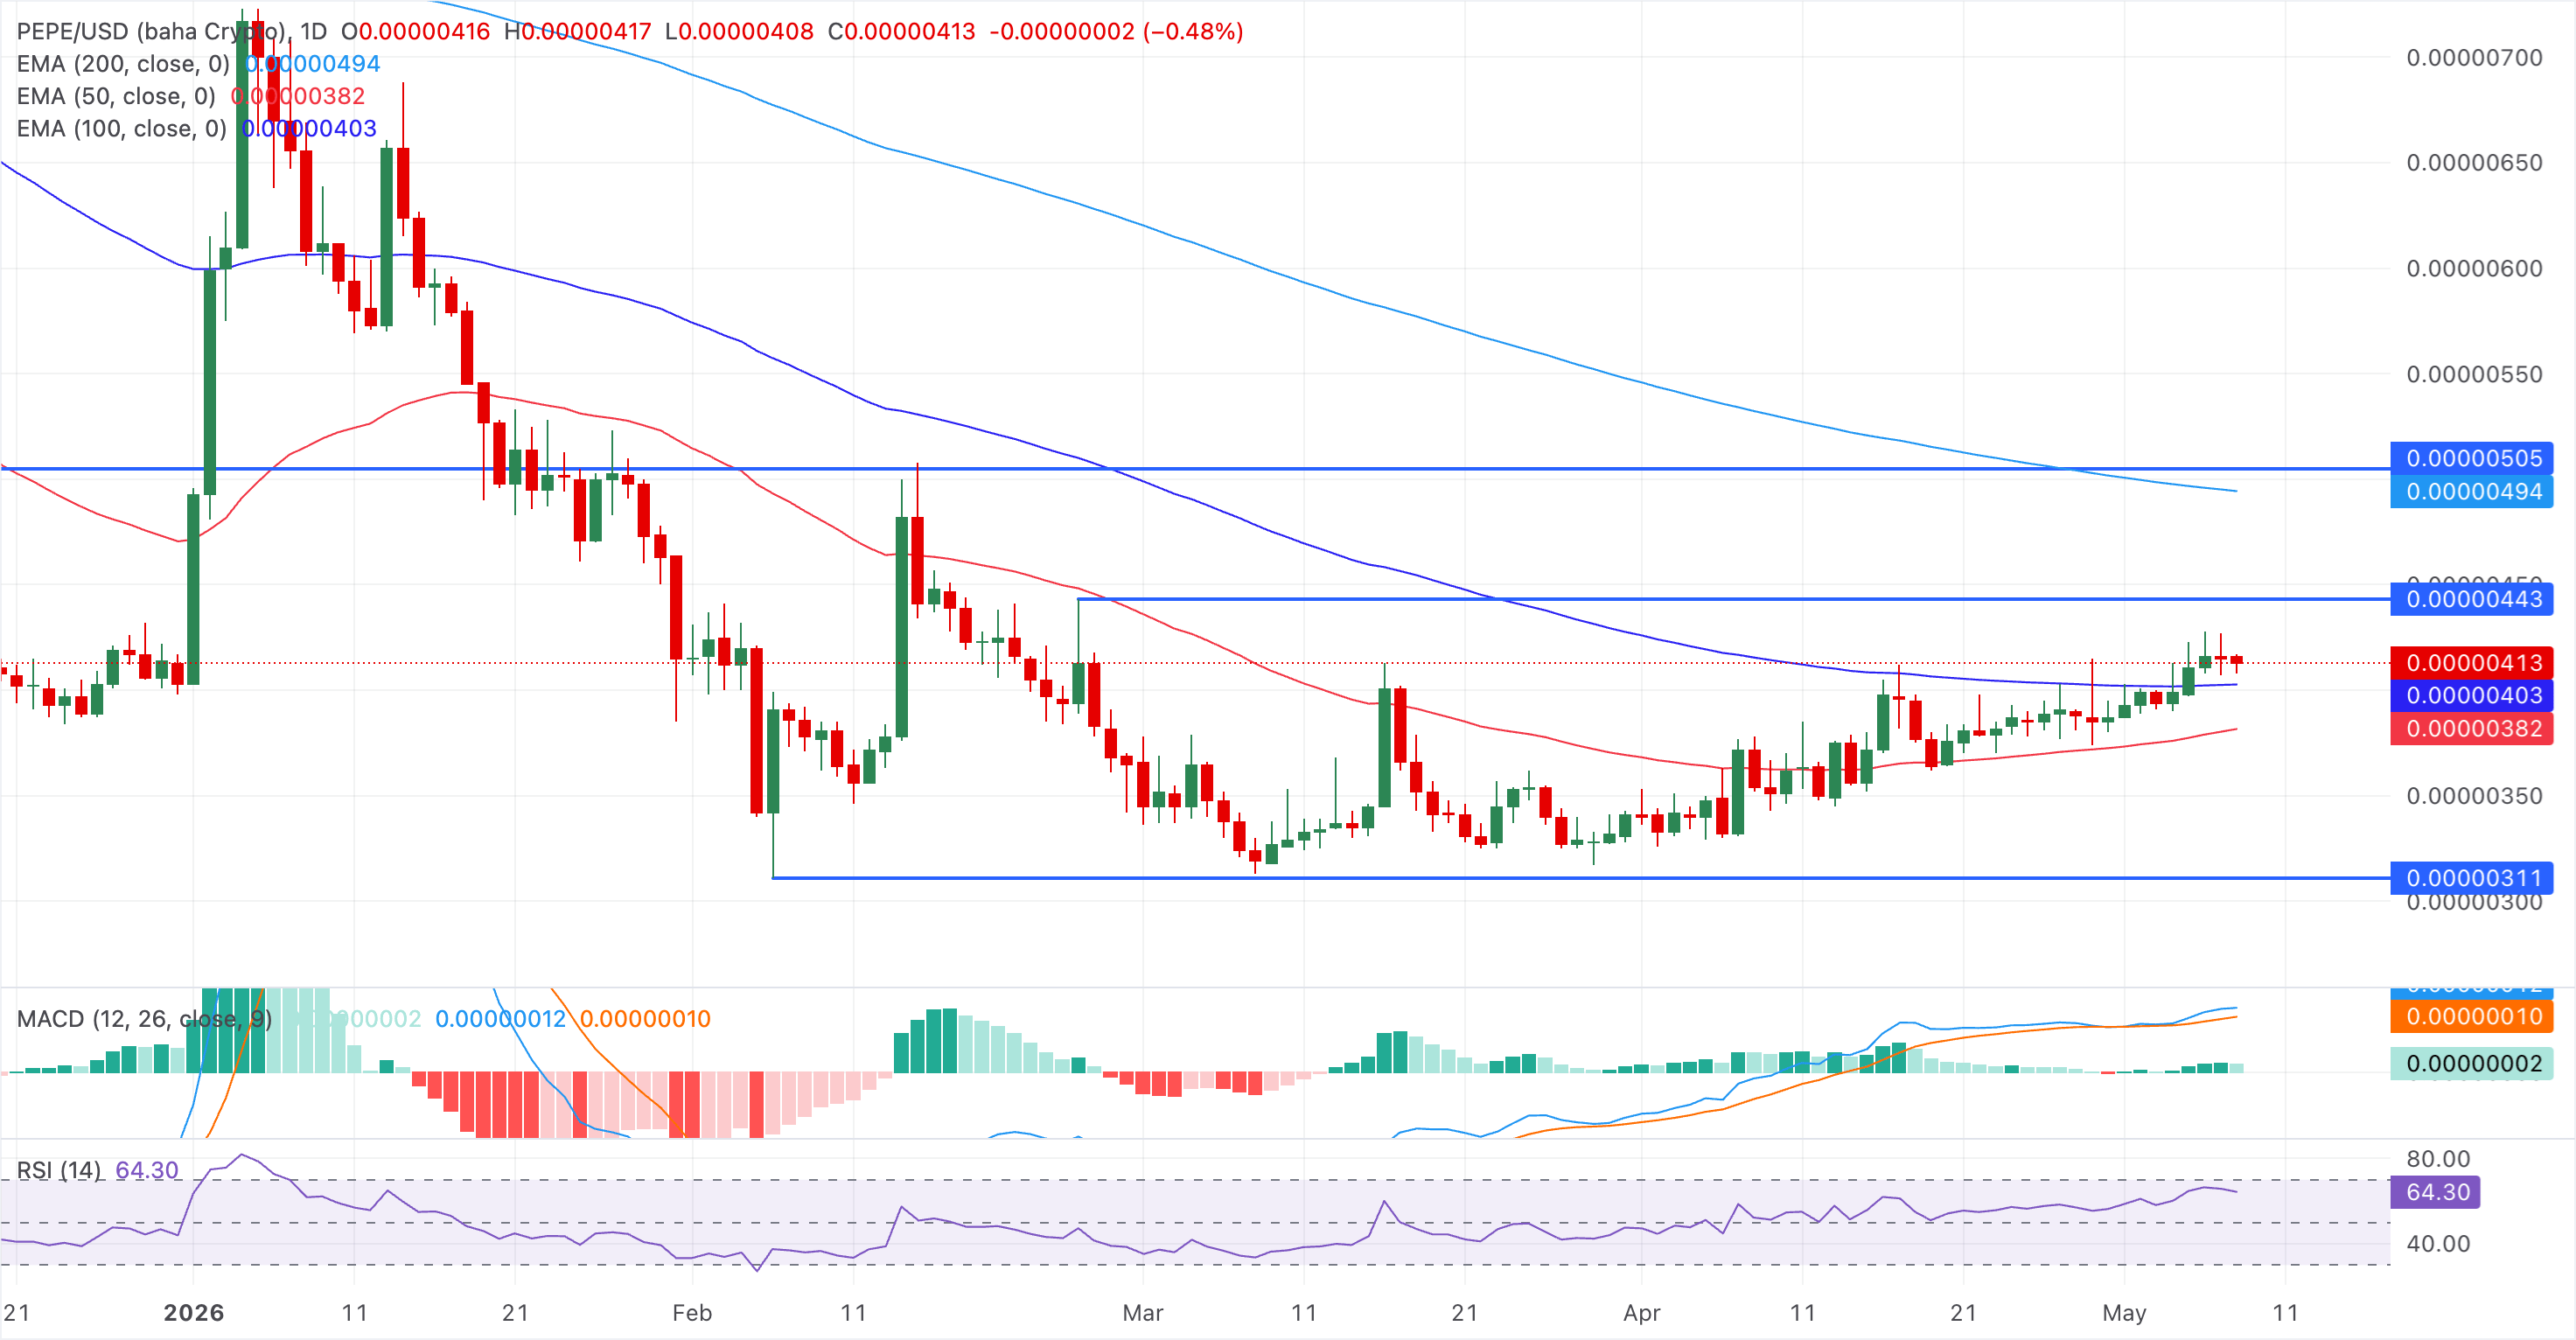
On the flip side, the 100-day EMA at $0.00000403 serves as immediate support that could help sustain the short-term recovery, followed by the 50-day EMA at $0.00000382.
(The technical analysis of this story was written with the help of an AI tool.)
Recommended Articles








Comments (0)
Click the $ button, enter the symbol, and select to link a stock, ETF, or other ticker.