


Ondo rallies on first-ever tokenized Treasury bill settlement



- Ondo is up 10% on Thursday, extending a steady upward trend for the seventh consecutive day.
- Ondo Finance, in partnership with J.P. Morgan, Mastercard, and Ripple, successfully piloted Ondo's OUSG tokenized short-term U.S. Treasury settlement on Wednesday.
- The technical outlook shows ONDO on a more bullish trend than XRP, which is approaching the apex of a triangle pattern.
Ondo Finance (ONDO) price extends a seven-day rally on Thursday on its first-of-its-kind OUSG tokenized short-term U.S. Treasury settlement. The ONDO price rally outperforms XRP, even as Ripple also participated in the project.
First-ever regulated tokenized Treasury bill settlement expands RWA
Ondo Finance, in partnership with Kinexys by J.P. Morgan, Mastercard, and Ripple’s XRP Ledger, successfully piloted the first-ever cross-border, interbank settlement of tokenized short-term US Treasuries on Wednesday.
Ripple redeemed Ondo’s OUSG t-bills near-instantly for US Dollars in its Singapore account, transferred from a JPMorgan bank account, outside the usual banking hours, and using Mastercard’s multi-token network.
The pilot expands the tokenized Treasury bills utility to a regulated, on-chain framework, moving away from its previous limitation to permissioned blockchains, like BlackRock’s BUIDL. The transition to a regulated, 24/7 on-chain framework is underpinned by the Financial Industry Regulatory Authority (FINRA), which approved Securitize Markets to provide custody, issuance, and atomic settlement for tokenized securities.
RWA.xyz data shows that the tokenized US t-bills are largely held by the USDC stablecoin issuer, Circle, and Ondo, each worth $2.9 billion. Meanwhile, the preferred network is Ethereum, which dominates $8.1 billion in tokenized US treasuries.
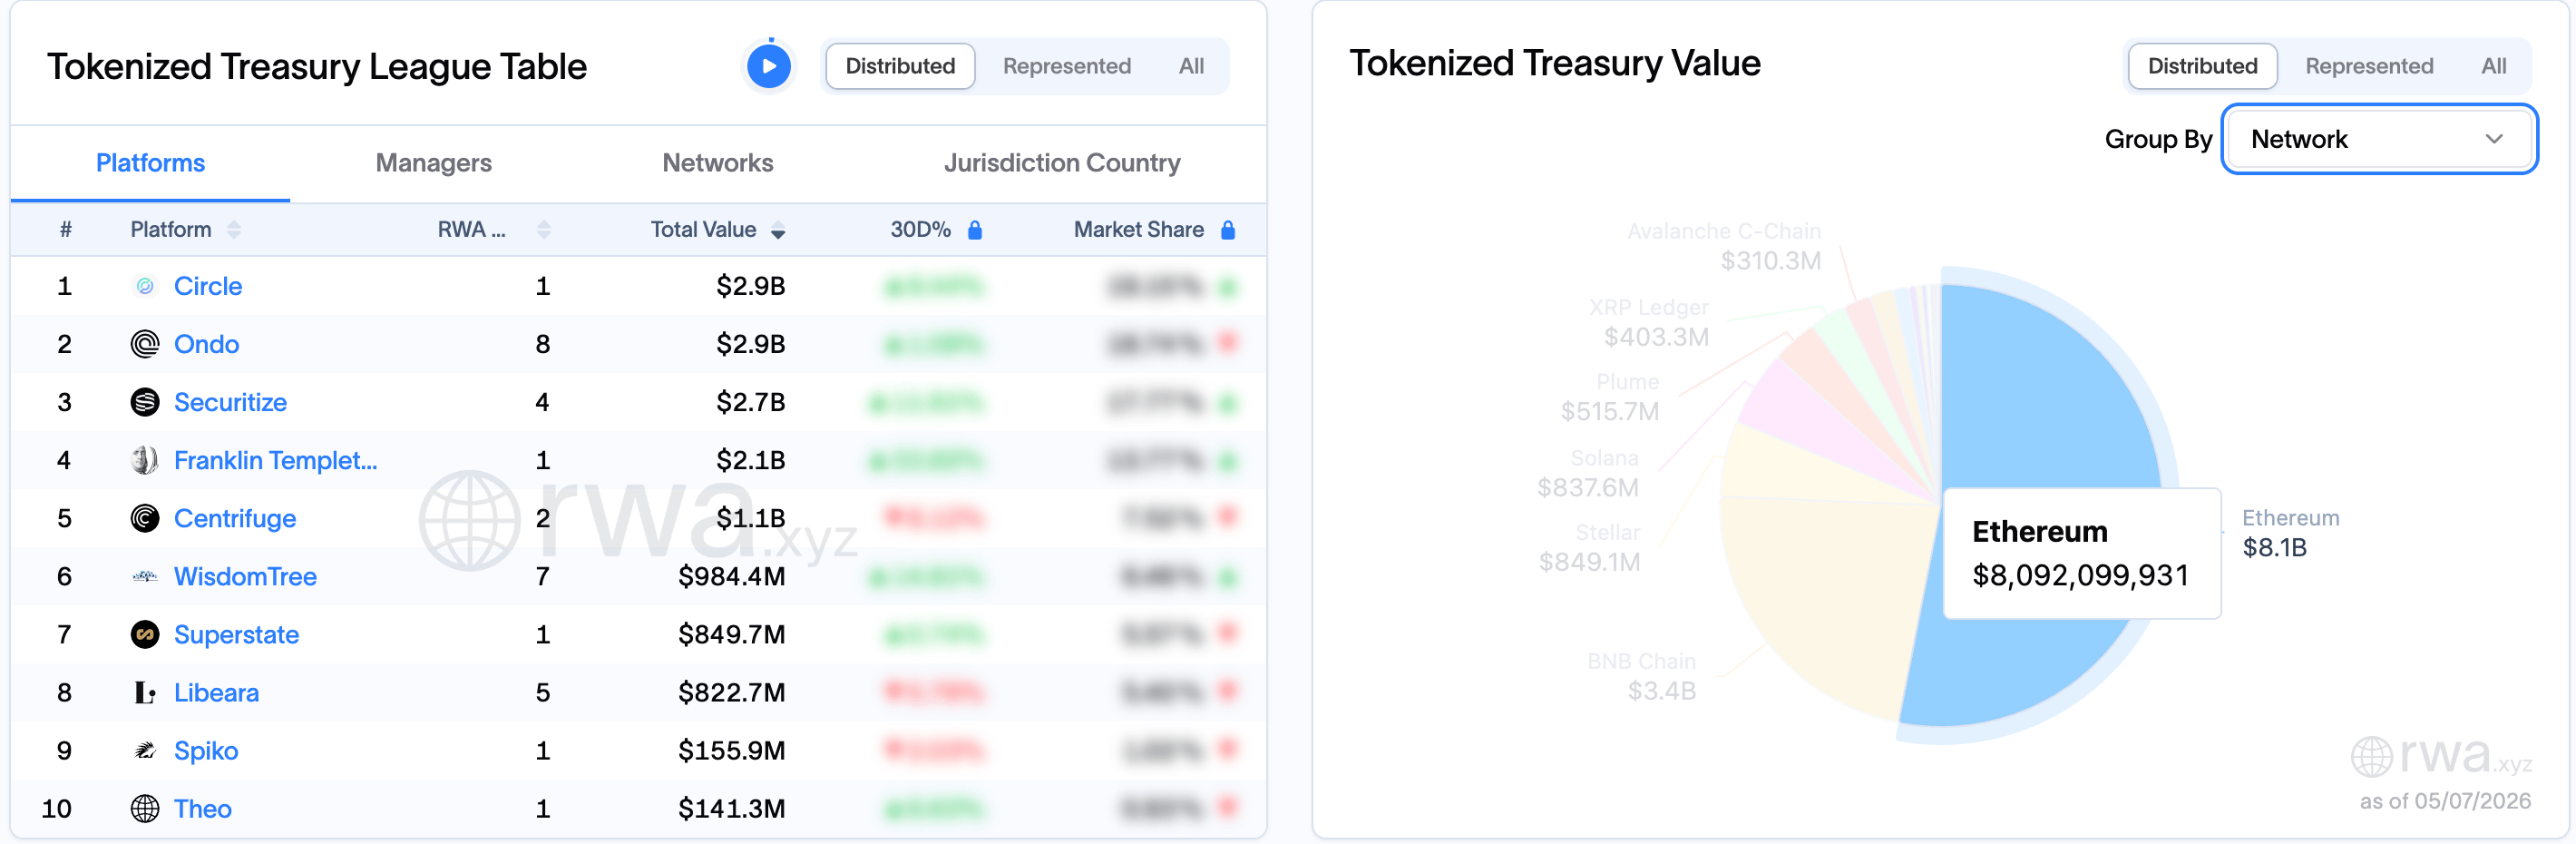
Additionally, the distributed value of tokenized US Treasury bills is $15.24 billion, actively subscribed to, held, and managed by on-chain investors.

Ondo price rally outperforms XRP
Ondo extends gains above $0.3000 at press time on Thursday, with a strong seven-day bullish streak above the 50-day Exponential Moving Average (EMA) at $0.2757 and the 100-day EMA at $0.3011. Still, the token trades beneath the longer-term 200-day EMA at $0.4008, suggesting an upside reversal after a long-term downtrend.
Momentum is stretched, with the Relative Strength Index (RSI) at 84 on the daily chart, deep in overbought territory, while the Moving Average Convergence Divergence (MACD) rises with the positive histogram bars widening, hinting that upside pressure persists but is increasingly vulnerable to corrective pullbacks.
On the topside, the December 19 low at $0.3601 is the next notable resistance, where medium-term sellers could attempt to cap the advance, targeting the 200-day EMA at $0.4008.
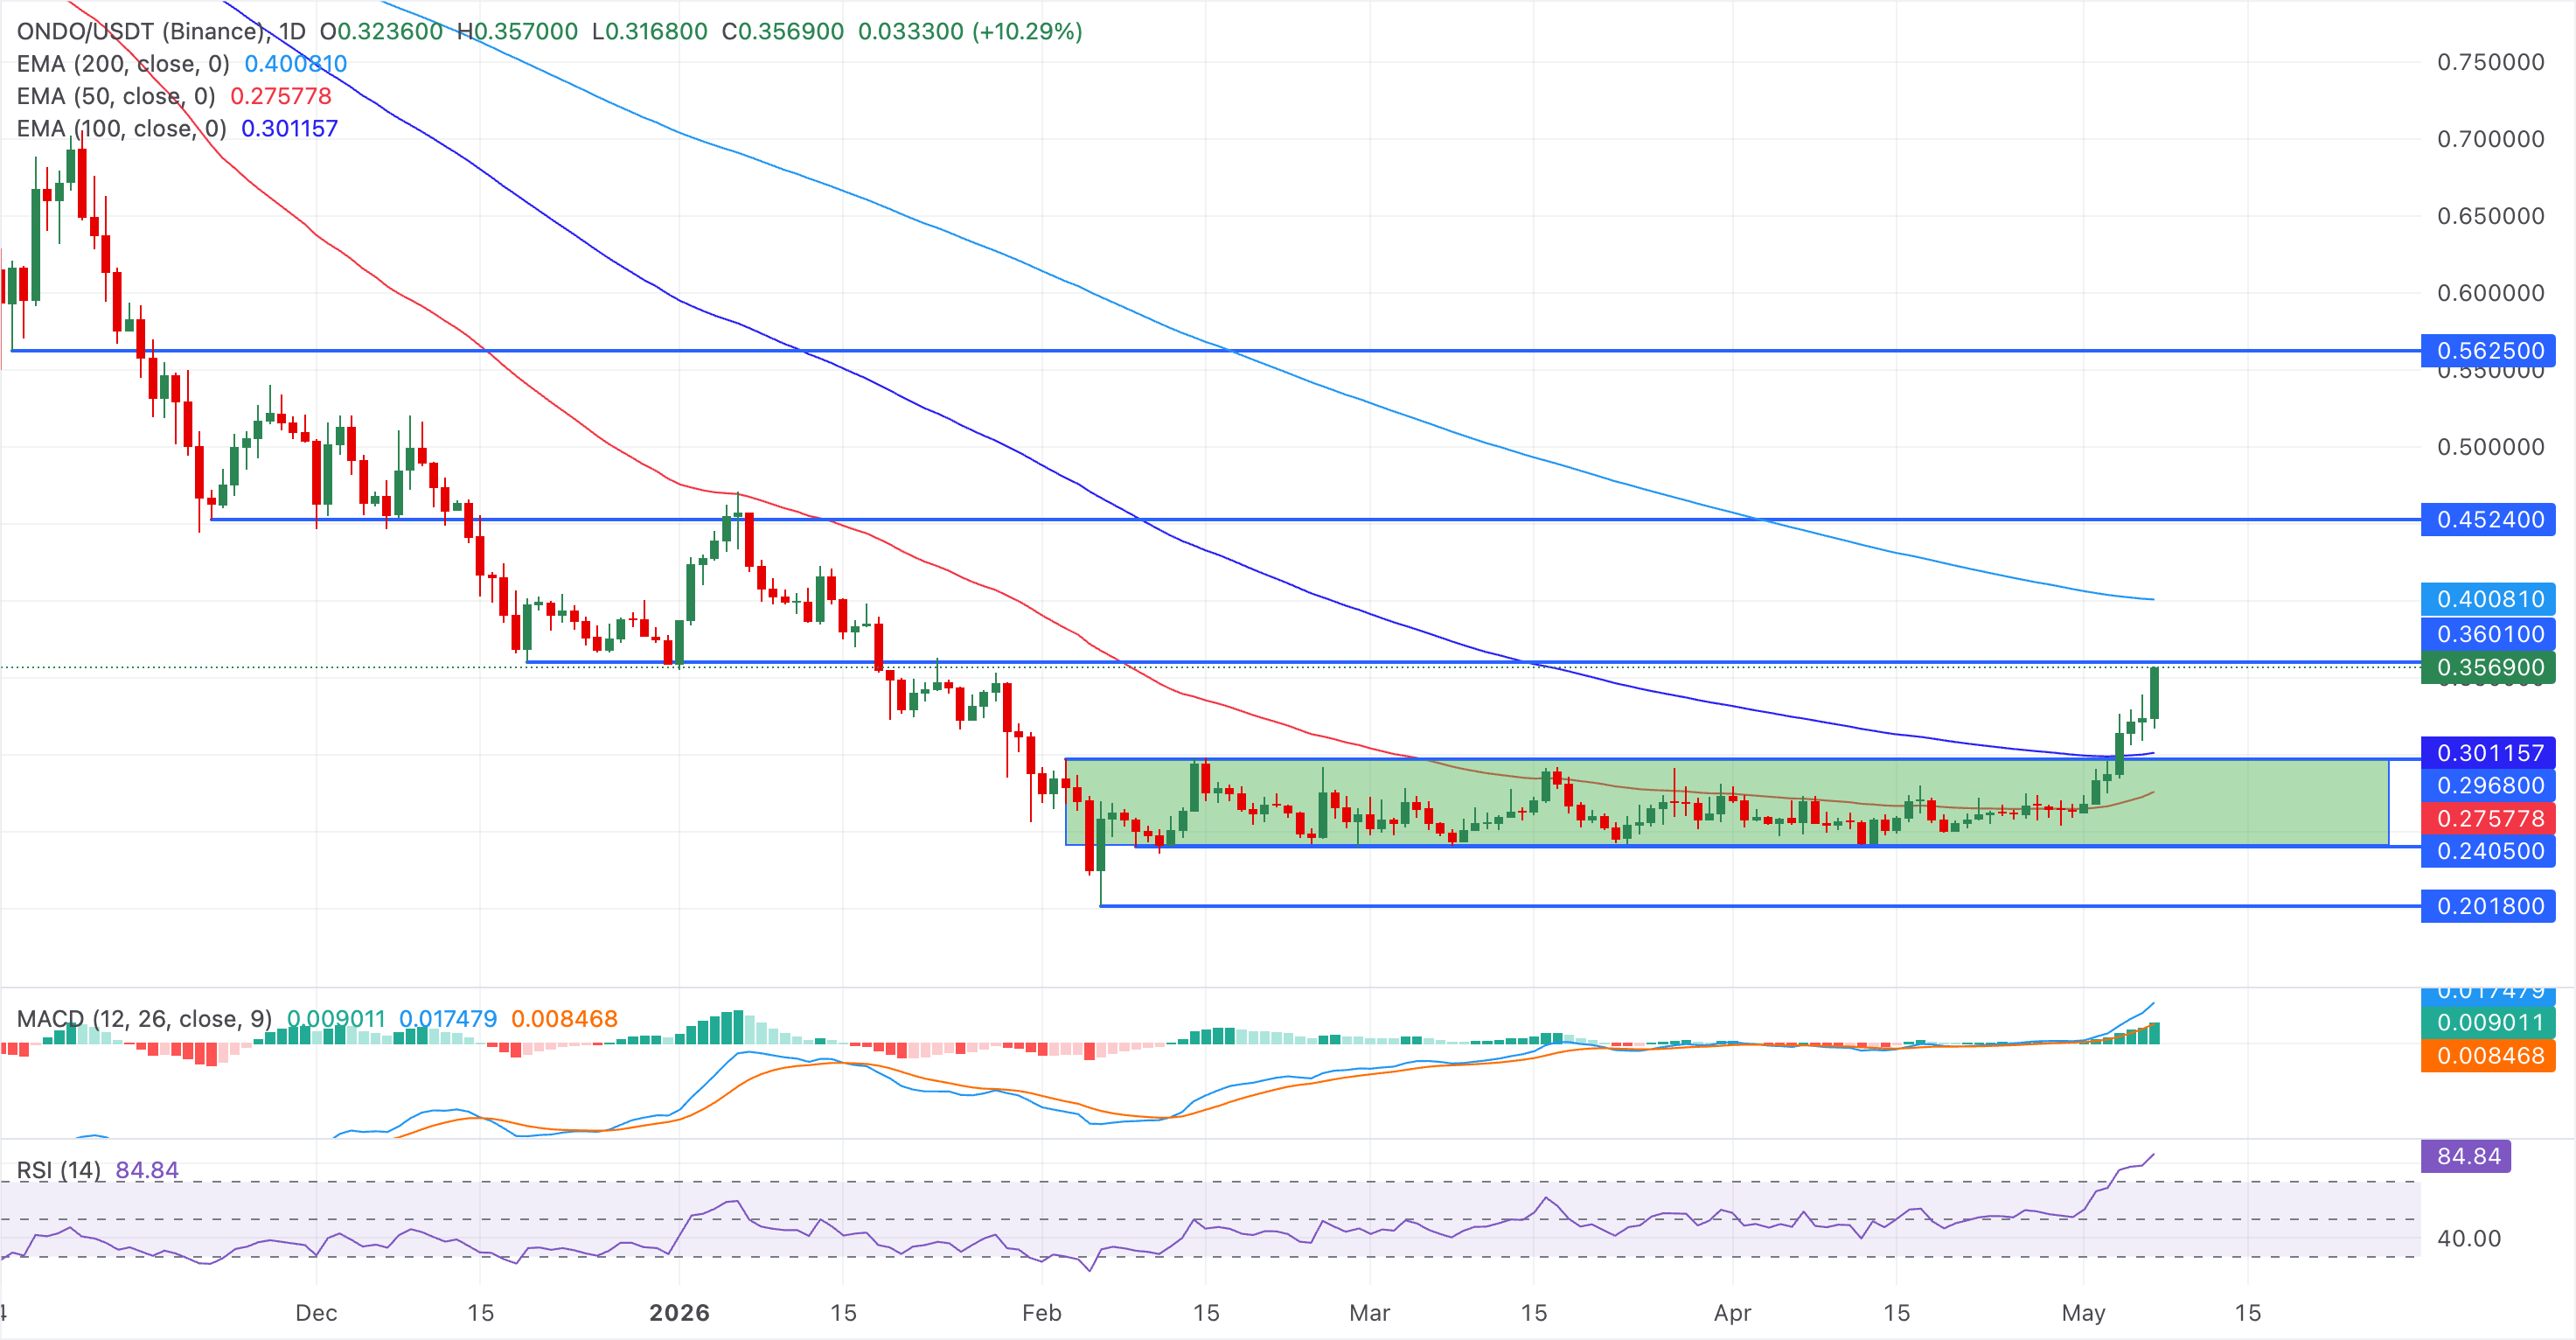
Initial support for XRP lies at the 100-day EMA at $0.3011, followed by stronger demand at the rising 50-day EMA near $0.2757, which reinforces the broader bullish structure while it holds.
On XRP, the token hovers above $1.40 at the time of writing on Thursday, just above the 50-day EMA at $1.4085. XRP maintains a steady upward trend from the uptrend support trendline of the symmetrical triangle pattern around $1.3717, suggesting a mildly constructive undertone.
Momentum metrics back this stabilizing bias, with the RSI at 54 on the daily chart, hovering just above the midline, while the MACD line marginally crosses above its signal line, hinting at a modest bullish tilt but not an aggressive trend.
Initial resistance emerges at the downward-sloping trendline at $1.4426, ahead of the heavier cap at the 100-day EMA around $1.5061, while the 200-day EMA up near $1.7255 marks a more distant barrier.
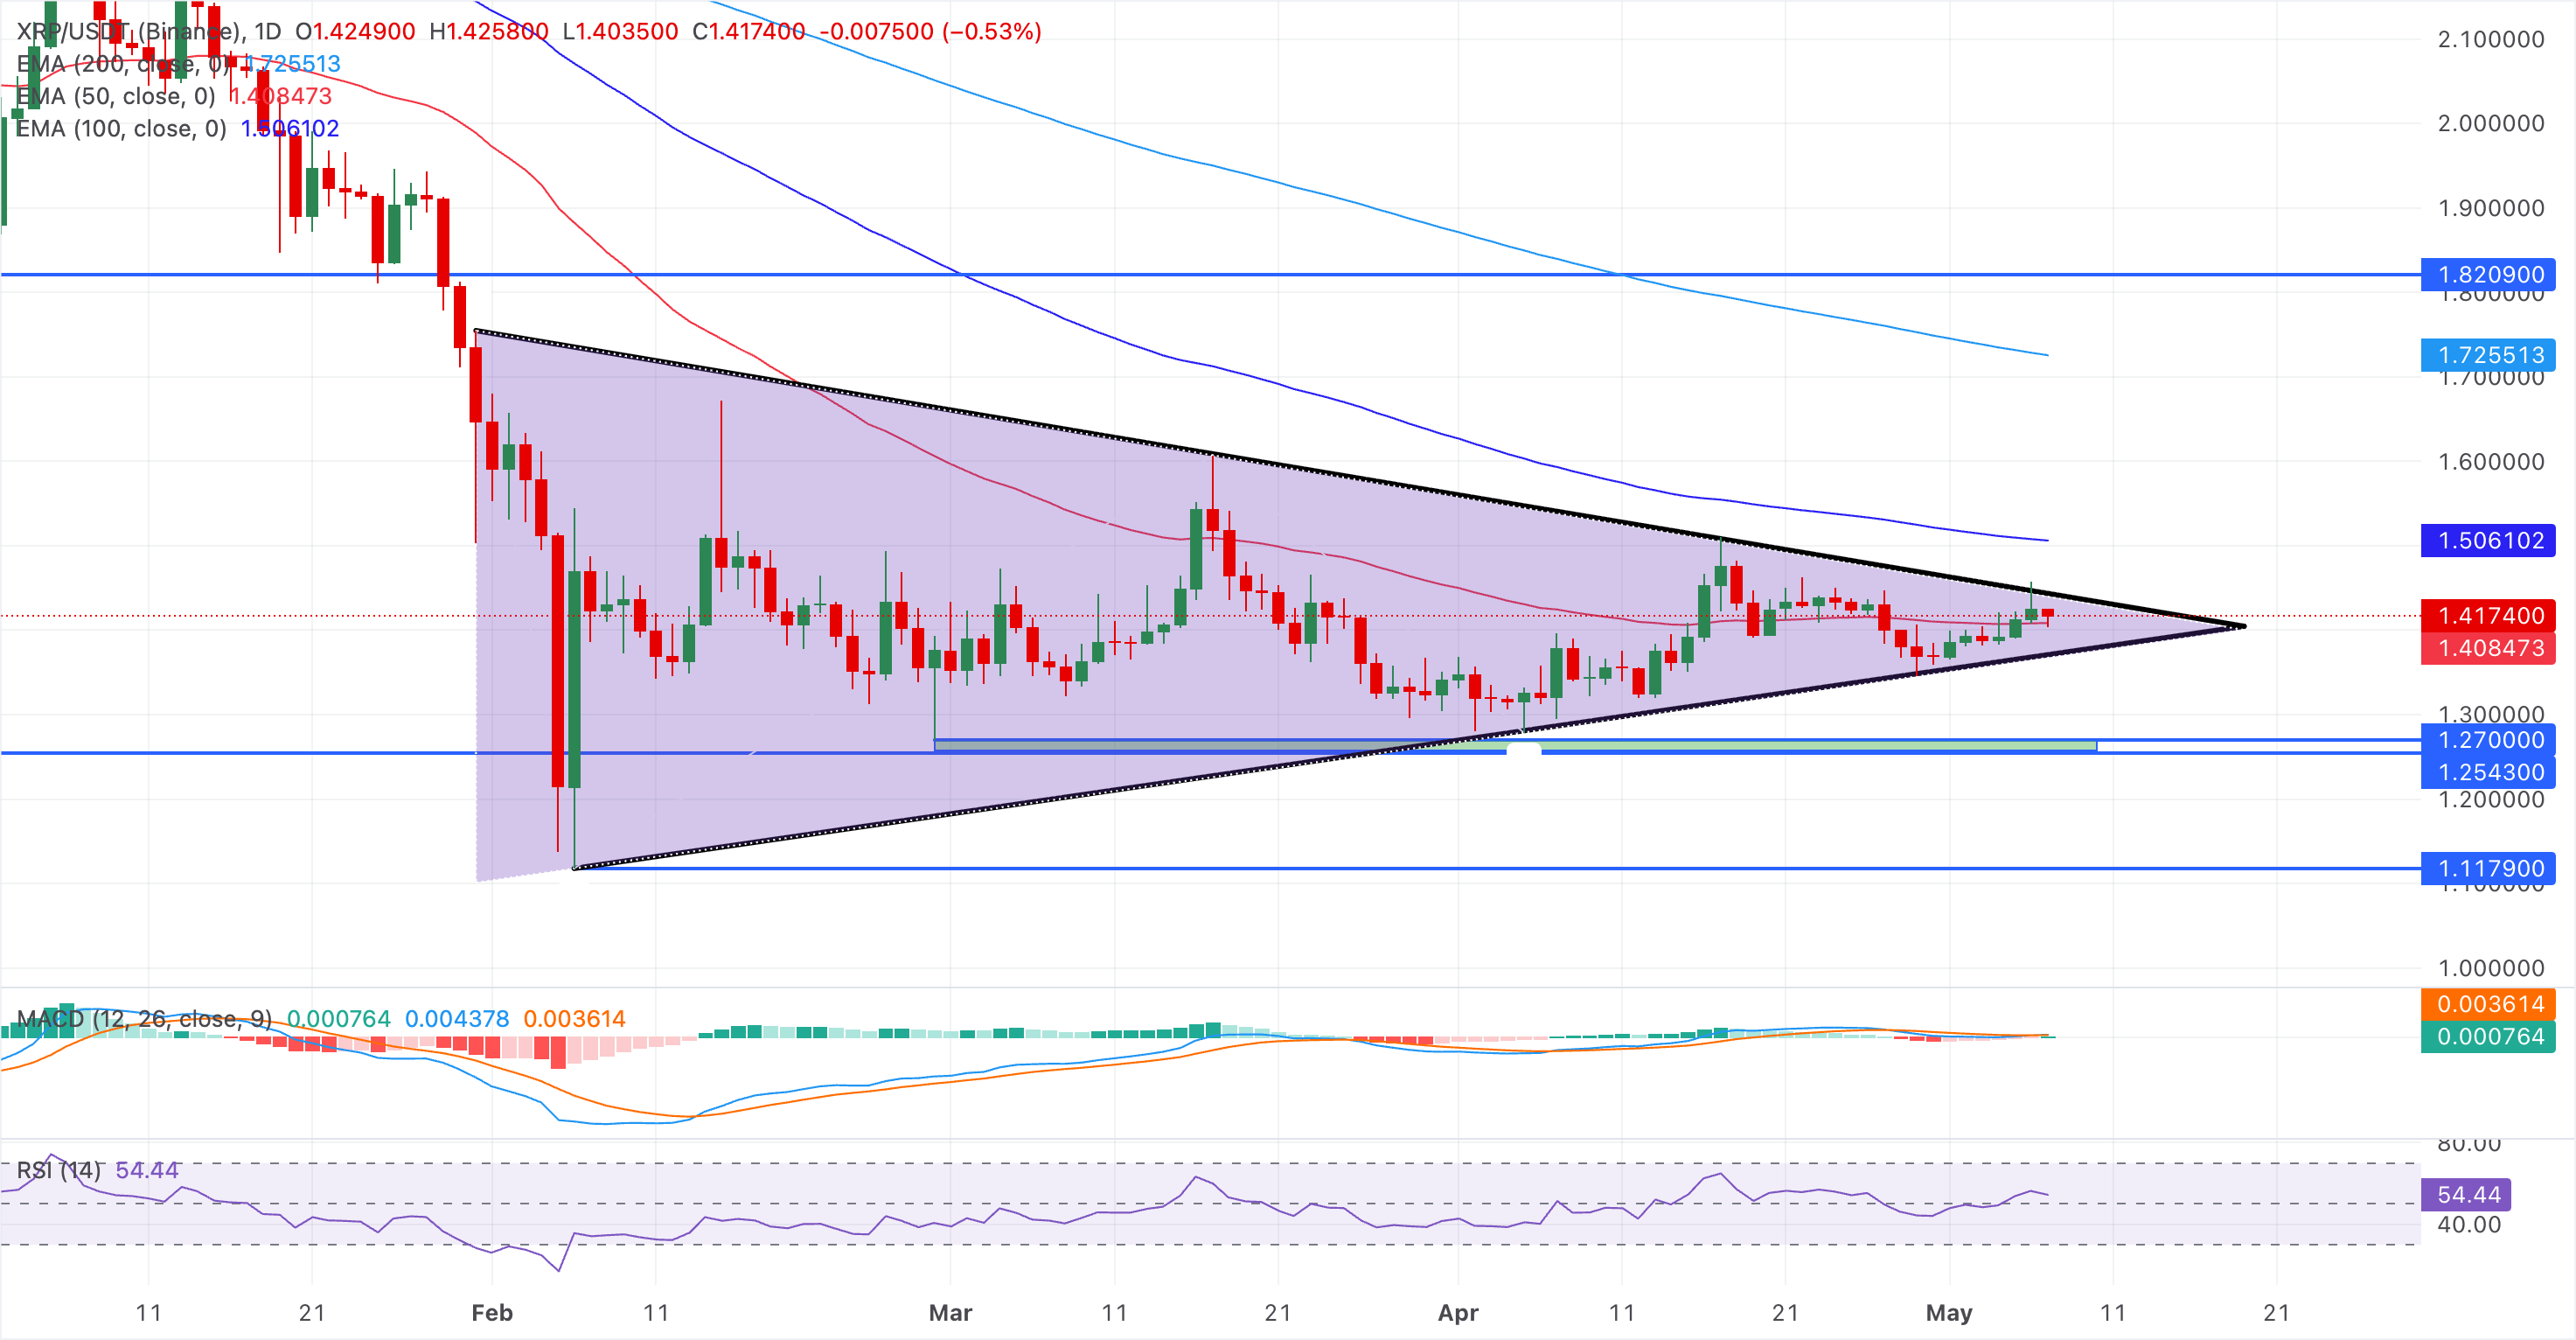
Looking down, the immediate support is seen at the 50-day EMA at $1.4085, with the rising trendline region near $1.3717 acting as a deeper floor. A daily close below that area would flip the constructive outlook bearish.
(The technical analysis of this story was written with the help of an AI tool.)
Recommended Articles








Comments (0)
Click the $ button, enter the symbol, and select to link a stock, ETF, or other ticker.