


Solana Price Forecast: SOL futures flash upside potential amid positional buildup



- Solana hovers at $87 on Wednesday, extending gains for the third consecutive day.
- SOL futures witness a rise in bullish bets amid steady ETF inflows, signaling an upside bias.
- The technical outlook implies a trendline breakout rally with potential to reach $100.
Solana (SOL) is trading above $87.00 at press time on Wednesday, maintaining an upward trend so far this week. Retail confidence is rising, leading to increased activity in SOL futures, while steady inflows into SOL-focused Exchange Traded Funds (ETFs) reflect institutional support. Technically, the breakout of a long-term resistance trendline on the 4-hour chart positions Solana for a rise toward $100.
Solana regains market and institutional support
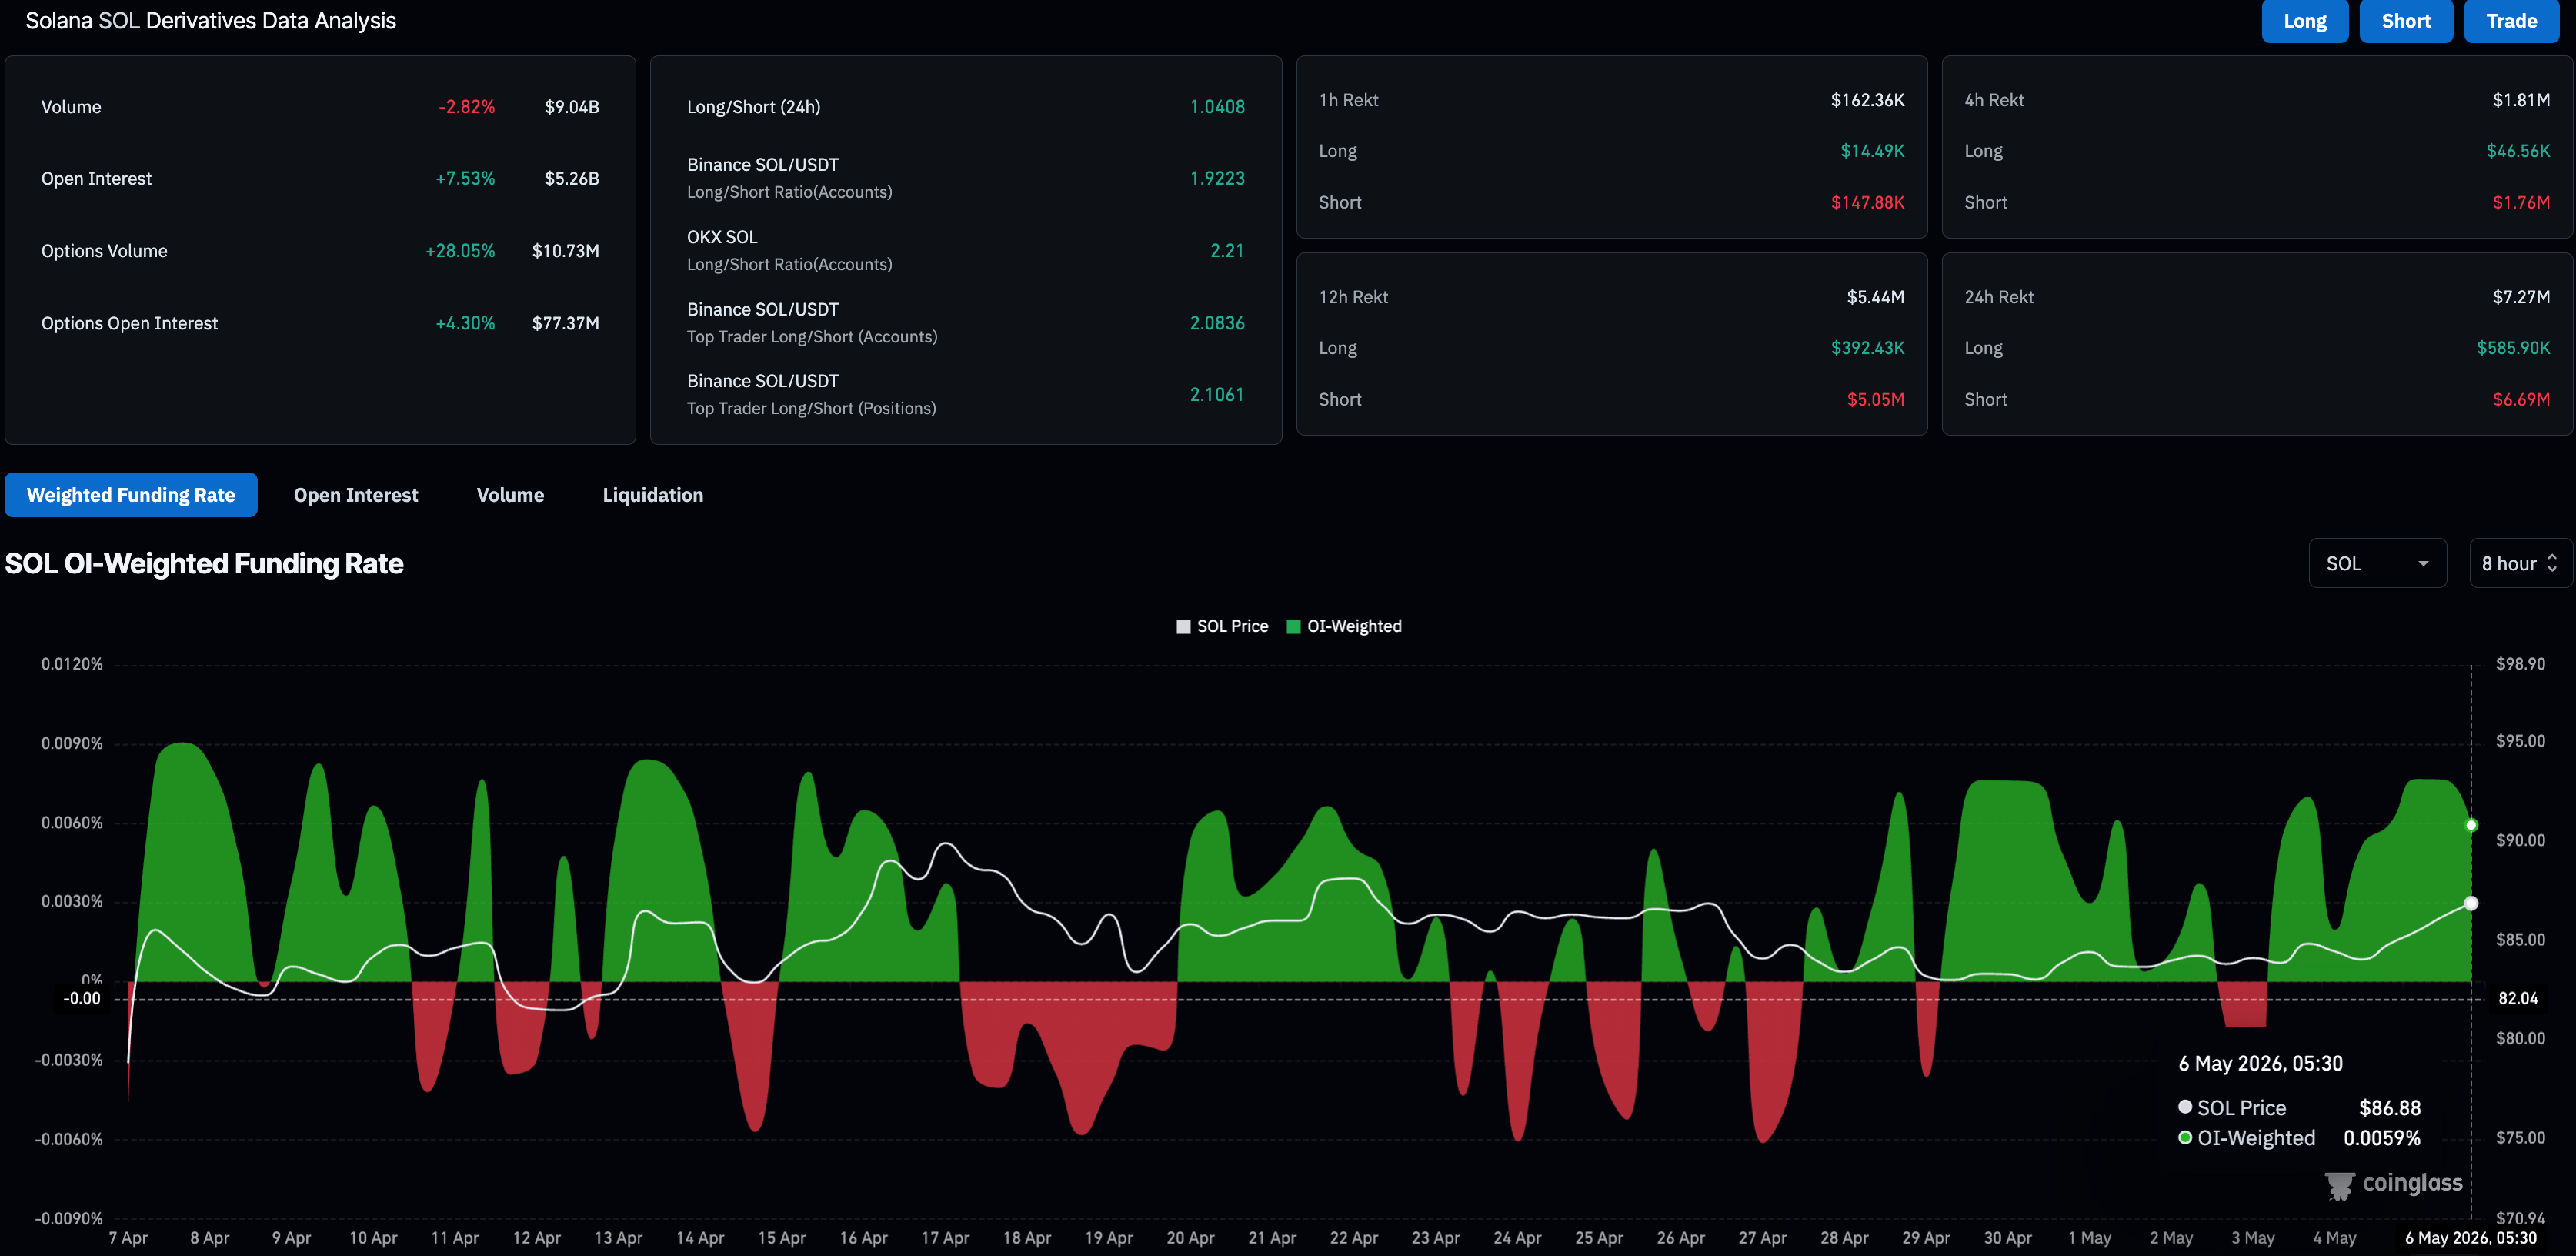
Retail and institutional support for Solana strengthens amid a broader market recovery, reflecting an upside bias. CoinGlass data shows the SOL futures Open Interest (OI) is up over 7% in the last 24 hours to $5.26 billion, suggesting an increase in the notional value of outstanding contracts. Typically, an increase in leverage exposure or the opening of new positions leads to an OI surge, suggesting a boost in trading activity.
The positive funding rate of 0.0059% reflects a bullish tilt in positioning, as traders are willing to pay a premium to go long. Additionally, the total liquidations of $7.27 million over the last 24 hours, led by $6.69 million in short liquidations, reaffirms the buy-side incline in the futures market.
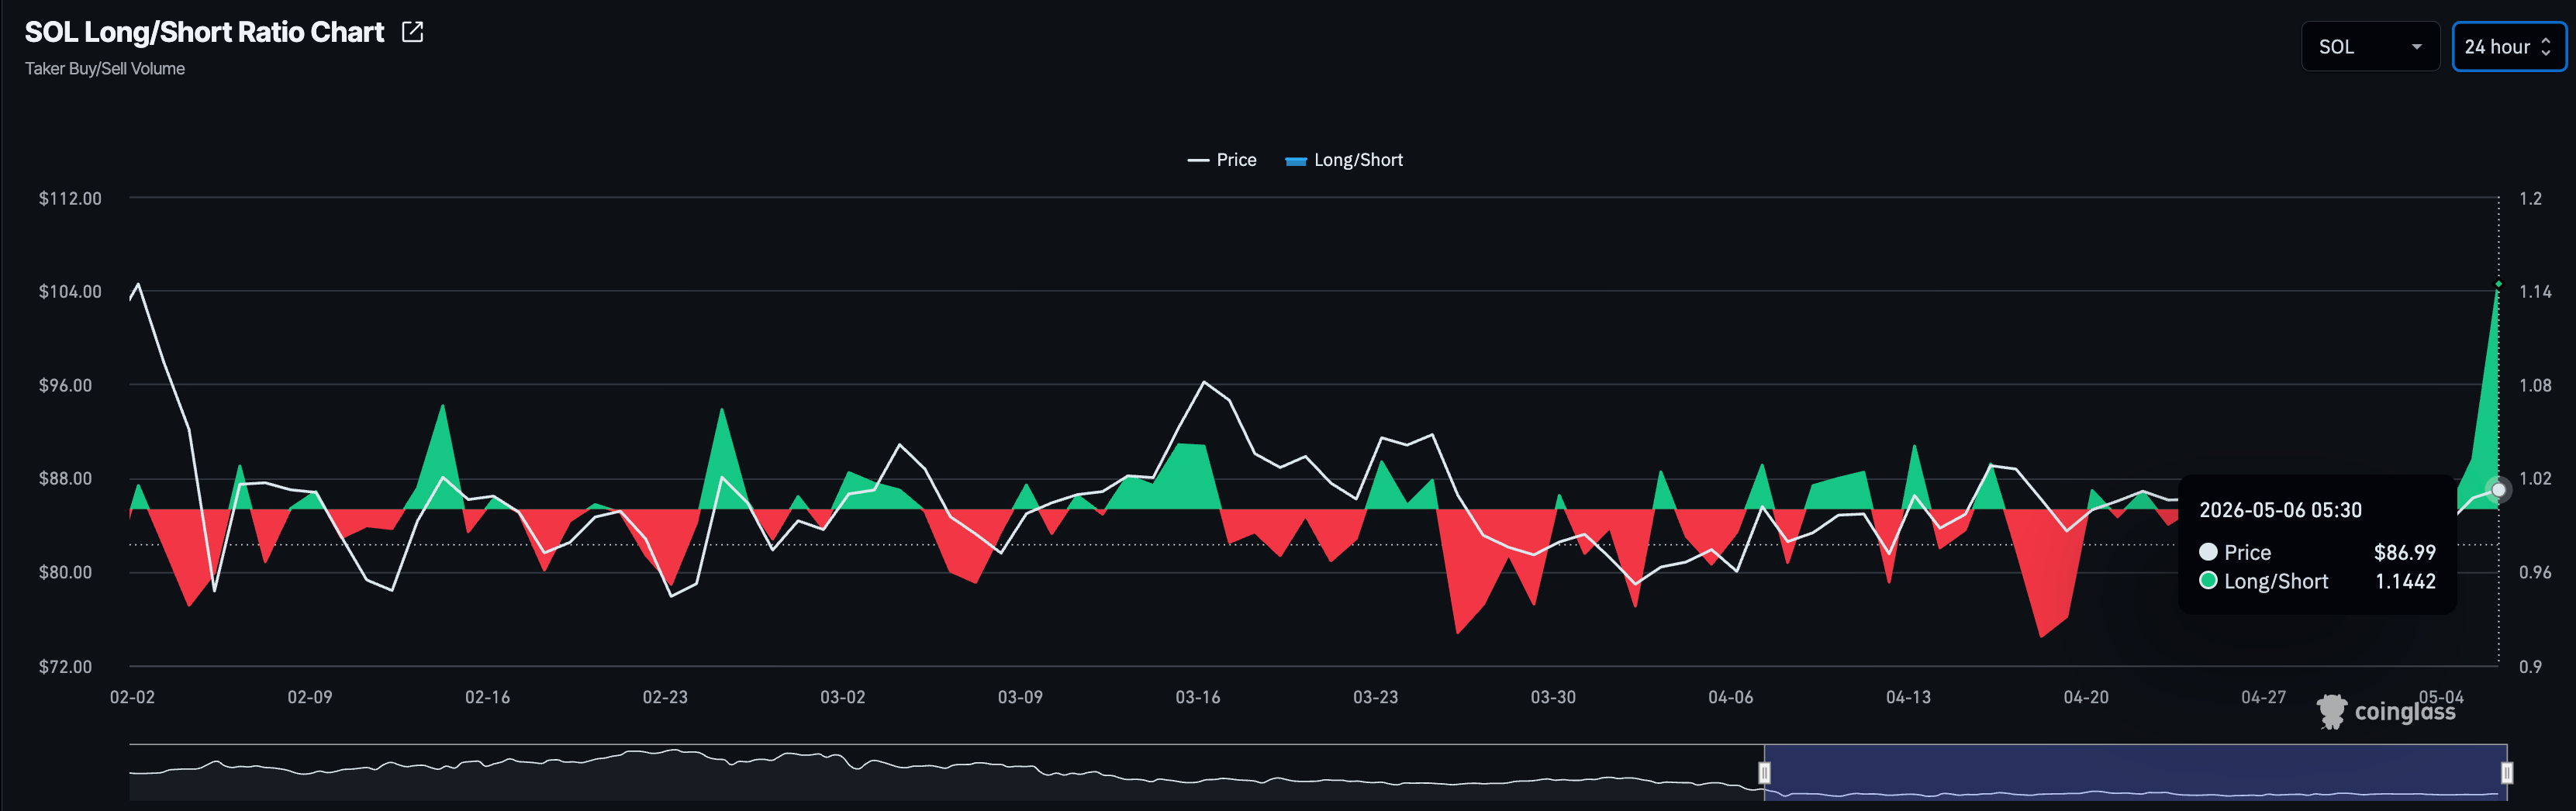
The long-to-short ratio chart shows a sharp increase to 1.1442 on Wednesday, from 1.0319, indicating a boost in the number of active long positions. This increase in bullish bets on SOL futures reflects traders' optimistic anticipation.
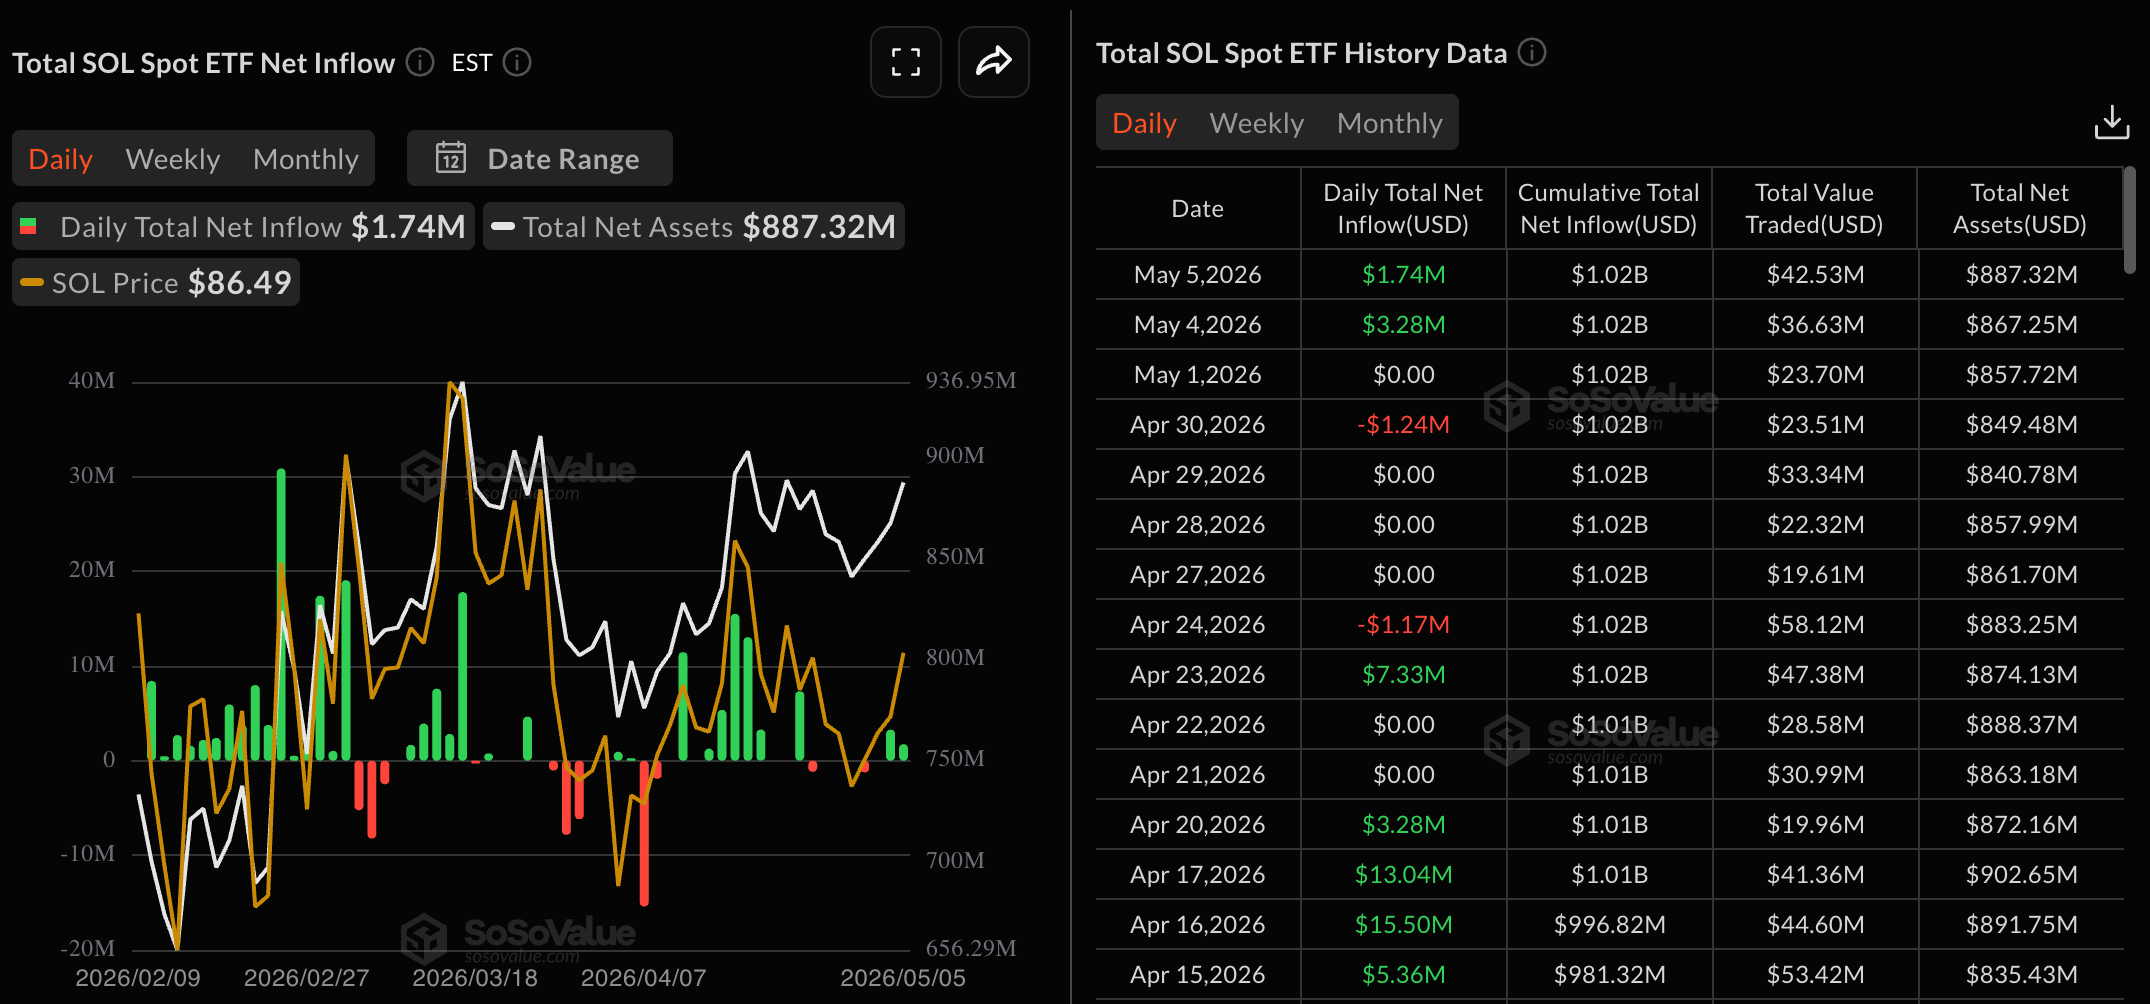
On the institutional side, the Solana spot ETFs recorded $1.74 million in inflows on Tuesday, after $3.28 million of inflows the previous day, reflecting renewed demand from institutional investors this week.
Will Solana's price rally reach $100?
Solana holds a clear bullish near-term bias as it trades above both the 50-period Exponential Moving Average (EMA) at $84.82 on the 4-hour chart and the 200-period EMA at $85.04, which are now acting as underlying support. The recent break above the previously downward-sloping resistance trendline, now offering support near $86.45, reinforces the constructive structure.
Momentum supports the upside, with the Relative Strength Index (RSI) at 68 on the 4-hour chart, reflecting increasing bullish momentum as it approaches the overbought threshold at 70. Meanwhile, the Moving Average Convergence Divergence (MACD) is holding in the positive territory above its signal line with firm positive histogram bars, hinting that buyers still retain control.
On the topside, Pivot Points map out short-term overhead resistances at $87.76, $91.26, $94.40, $97.62, and $100.80 on the same chart, which could cap the breakout rally.
On the downside, immediate support is seen at the reclaimed trendline area around $86.45, ahead of the 200-period EMA at $85.04 and the 50-period EMA at $84.82, which together form a dense demand zone on pullbacks.
(The technical analysis of this story was written with the help of an AI tool.)
Recommended Articles








Comments (0)
Click the $ button, enter the symbol, and select to link a stock, ETF, or other ticker.