


Meme Coins Price Prediction: DOGE rallies, SHIB breaks out, Pepe holds bullish structure



- Dogecoin rises above $0.115 on Wednesday after surging over 6% so far this week.
- Shiba Inu closes above the upper boundary of its consolidation at $0.0000063, signaling a rally ahead.
- Pepe holds above the 100-day EMA at $0.0000040, suggesting bullish strength and an upside leg.
Dogecoin (DOGE), Shiba Inu (SHIB), and Pepe (PEPE) extend their gains this week as improving market sentiment across meme coins supports them. DOGE leads the gains after climbing above $0.115, while SHIB confirms a breakout from its consolidation range, signaling a potential rally ahead. Meanwhile, PEPE maintains strength above its key technical support, suggesting further upside.
Dogecoin extends gains over 6% so far this week
Dogecoin price is extending its gains, trading above $0.115 on Wednesday, up over 6% so far this week, and holding above the key 50-day and 100-day EMAs at $0.100 and $0.105, respectively.
If DOGE continues its upward momentum, it could extend the gains toward the weekly resistance at $0.119.
The Relative Strength Index (RSI) on the daily chart is 80, above the overbought threshold and pointing upward, indicating strong bullish momentum. Moreover, the Moving Average Convergence Divergence (MACD) indicator on the same chart shows rising green histogram bars, supporting the positive outlook.
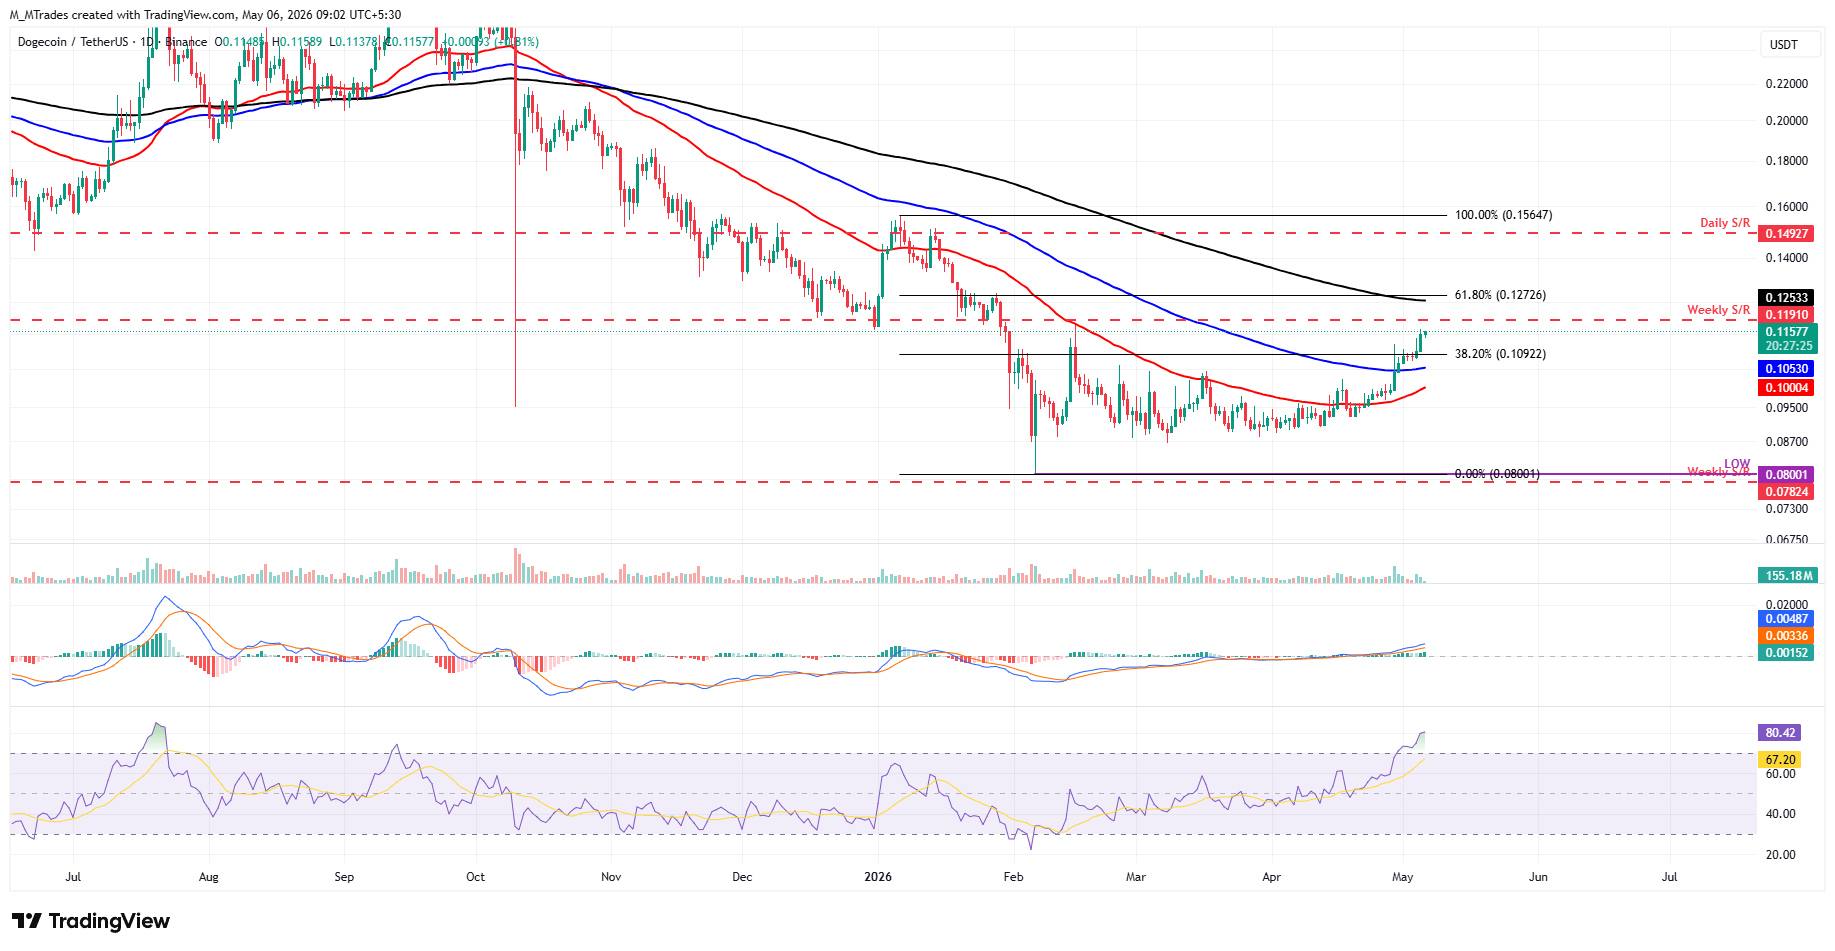
On the other hand, if DOGE corrects, it could extend the decline toward the 100-day EMA at $0.105.
Shiba Inu breaks above the consolidation range
Shiba Inu price found support around the 50-day EMA at $0.0000061 on Sunday and has extended gains, breaking above the upper consolidation boundary at $0.0000064 on Tuesday. As of writing on Wednesday, it nears the 200-day EMA at $0.0000064.
If SHIB holds above this upper boundary on a daily basis and closes above the 200-day EMA, it could extend the rally toward the weekly resistance at $0.0000068.
The RSI on the daily chart reads 63, above the neutral level of 50 and below the overbought threshold, indicating bullish momentum. Moreover, the MACD indicator on the same chart shows green histogram bars, supporting the positive outlook.
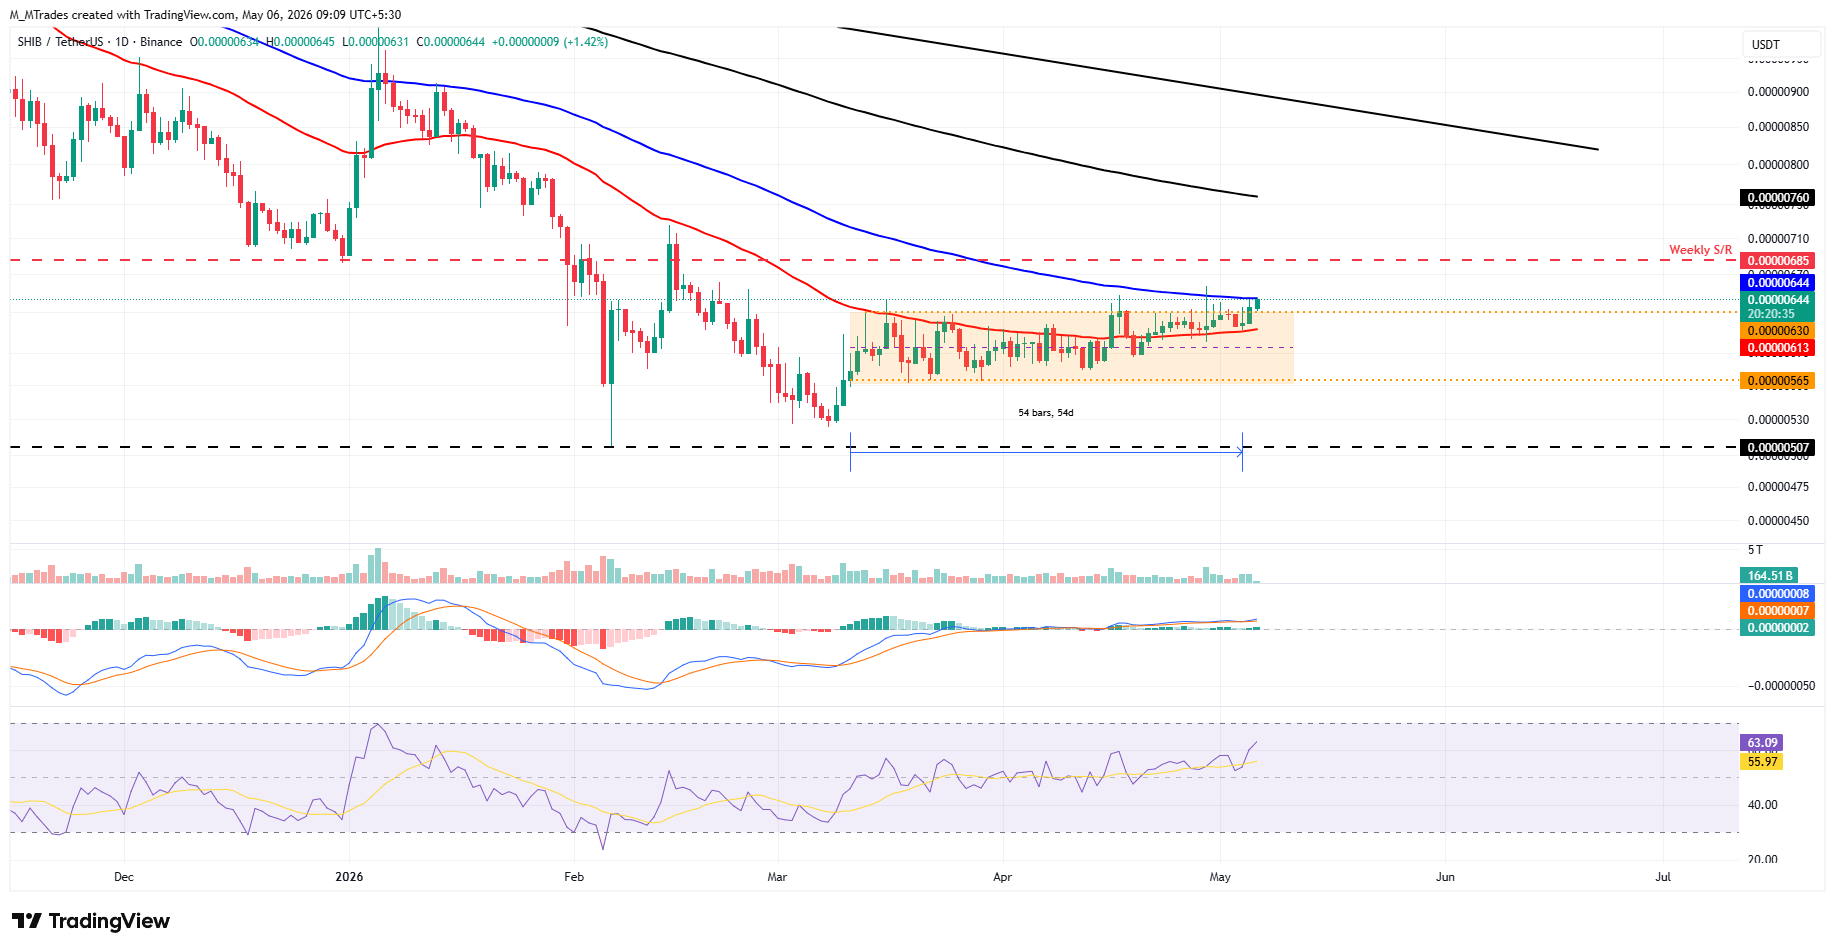
However, if SHIB faces a correction, it could extend the decline toward the 50-day EMA at $0.0000061.
Pepe closes above the 100-day EMA
Pepe price closed above the 100-day EMA at $0.0000040 on Tuesday and is extending its gains, trading above $0.0000042 on Wednesday.
If the 100-day EMA at $0.0000040 holds as support, PEPE could extend the rally toward the 200-day EMA at $0.0000049, just below the daily resistance at $0.0000052.
The RSI on the daily chart is 68, nearing the overbought territory and pointing upward, indicating strong bullish momentum. Moreover, the MACD also shows a bullish crossover with rising green histogram bars, supporting the positive outlook.
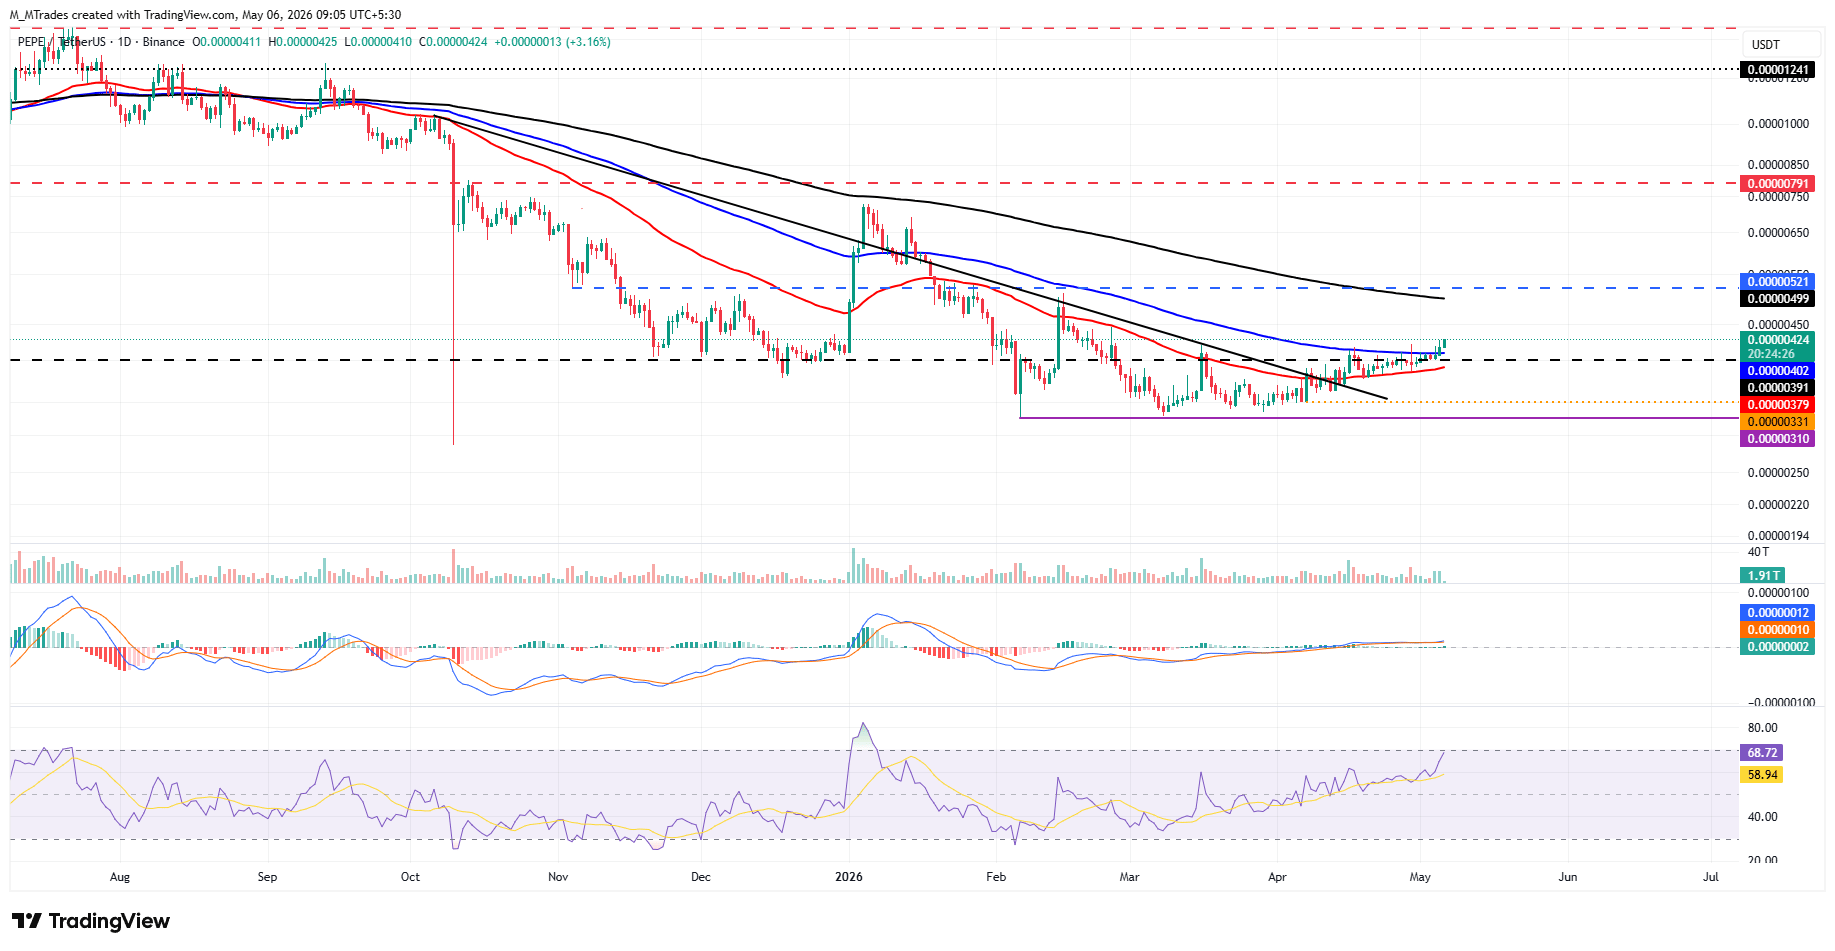
However, if PEPE faces a rejection, it could extend the decline toward the 100-day EMA at $0.0000040.
Recommended Articles








Comments (0)
Click the $ button, enter the symbol, and select to link a stock, ETF, or other ticker.