


Cardano Price Forecast: ADA signals triangle breakout as retail interest spikes



- Cardano extends gains above $0.2500 on Tuesday, with bulls eyeing an upside breakout of a triangle pattern.
- Derivatives data shows heightened leverage-linked retail interest as traders anticipate further upside.
- The technical outlook remains largely mixed as the overhead resistance trendline has capped short-term recoveries since late February.
Cardano (ADA) trades above $0.2500 at press time on Tuesday, extending gains toward a key resistance trendline after an indecisive close on Monday. The altcoin is gaining retail strength, anticipating further upside on a potential breakout. Cardano should clear the 50-day Exponential Moving Average (EMA) at $0.2555 to extend its recovery.
Retail demand rises on breakout anticipation
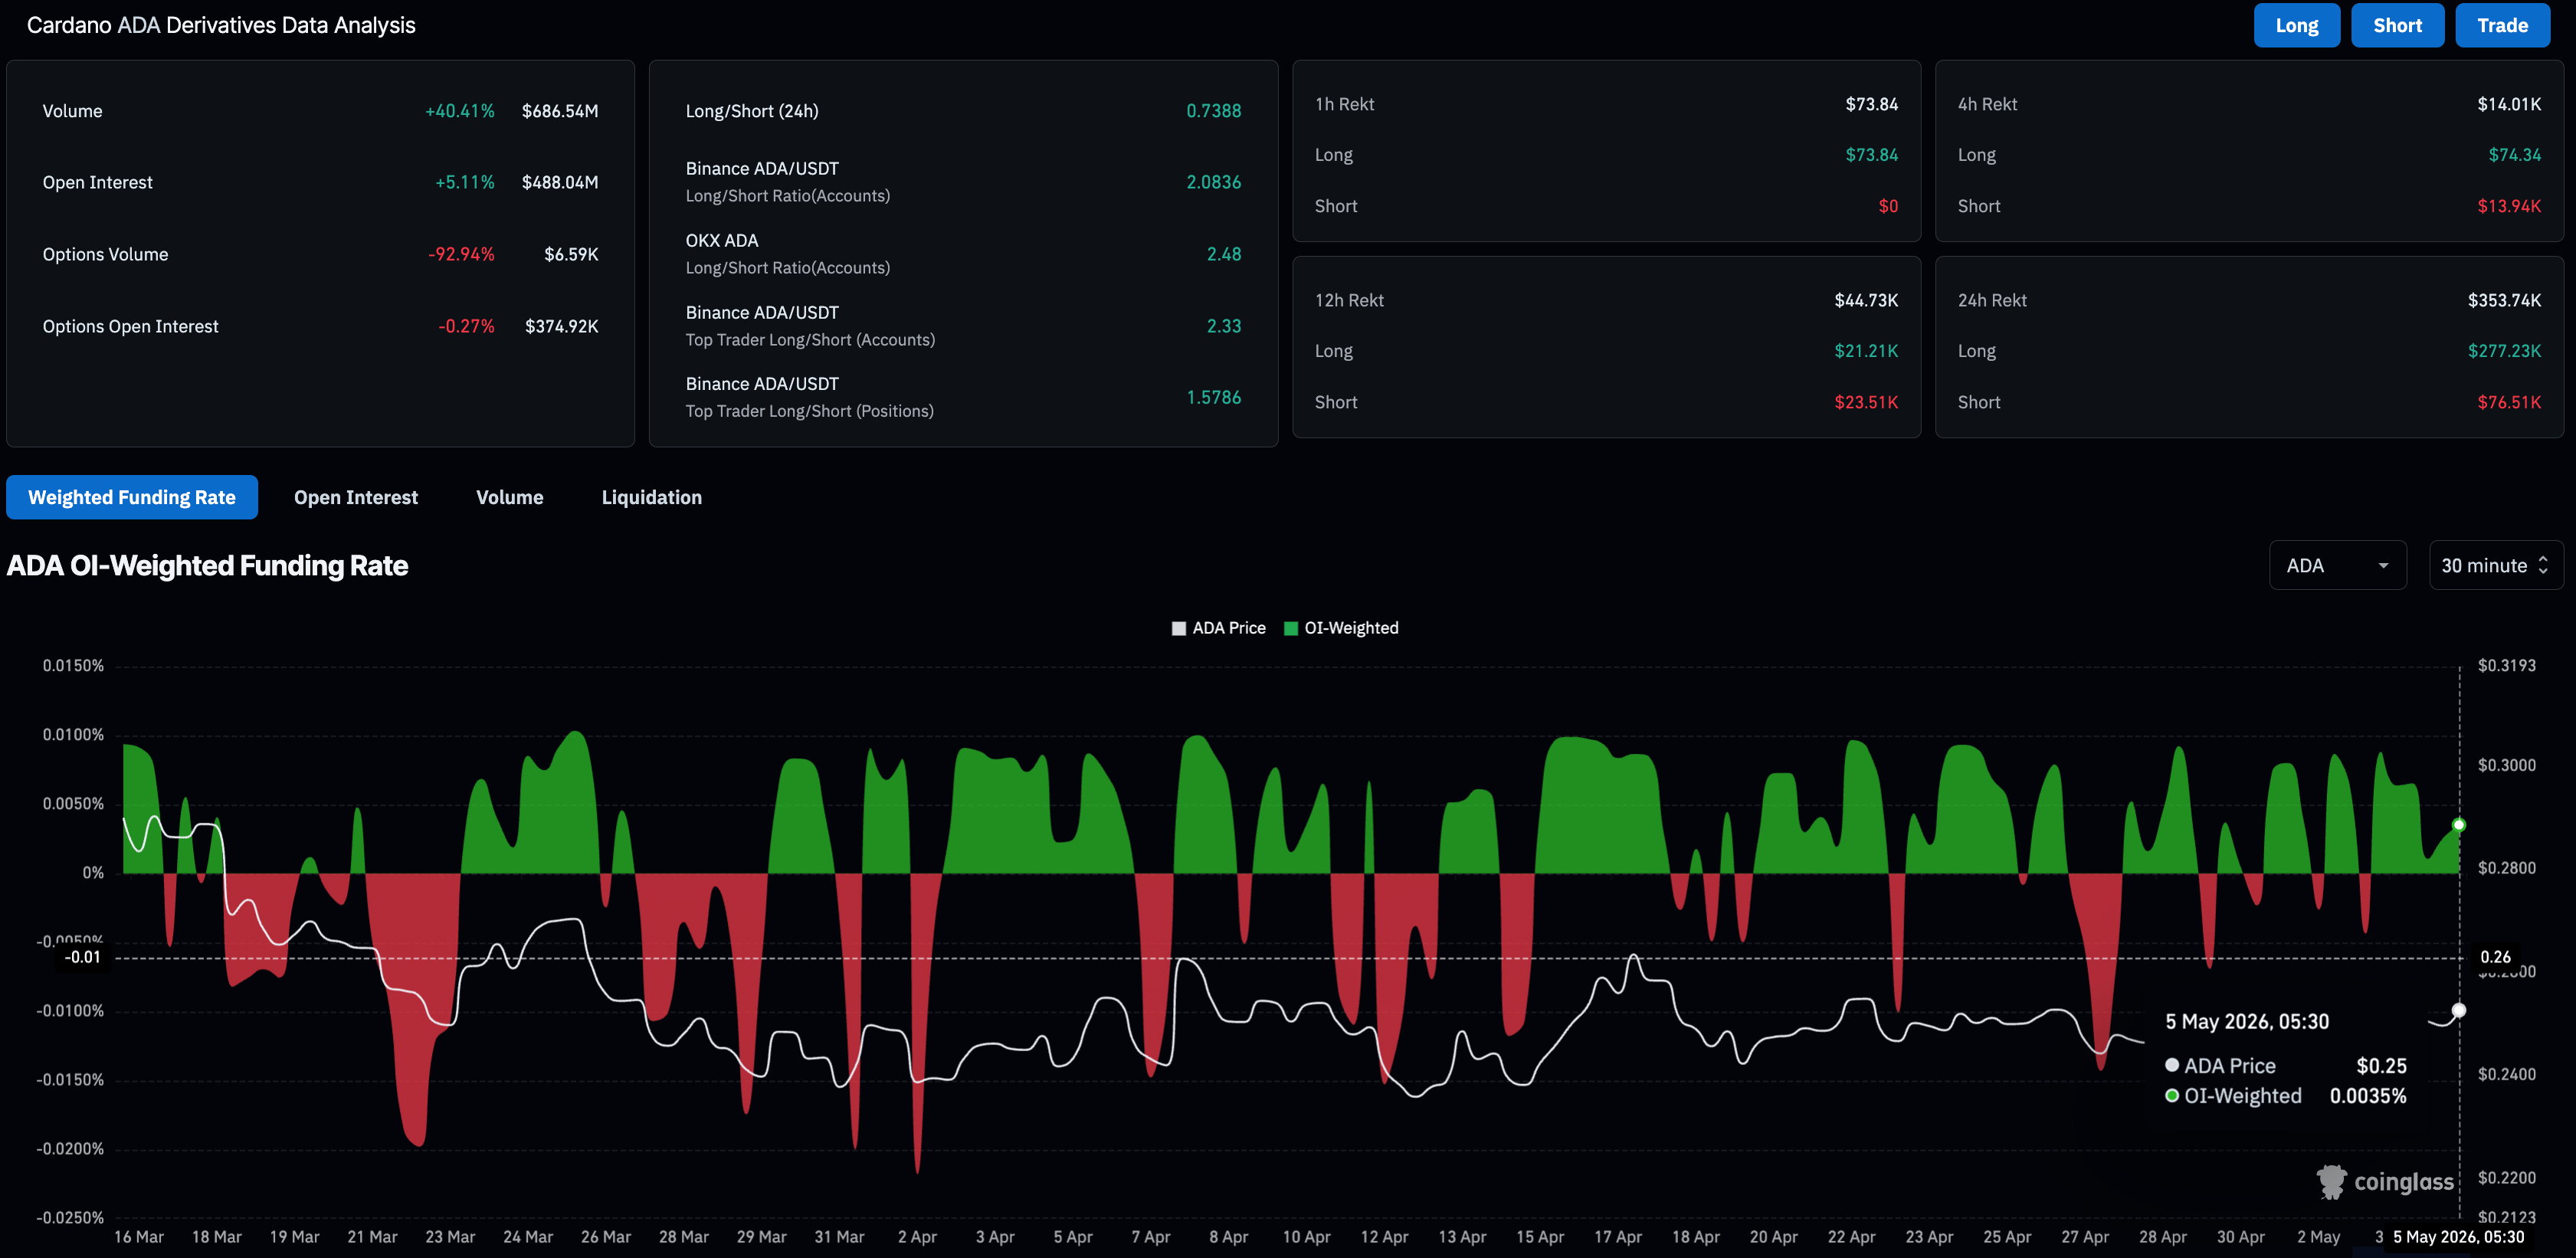
Cardano is gaining retail strength as Bitcoin (BTC) is holding above $80,000 on Tuesday, easing downside pressure on altcoins. CoinGlass data shows the ADA futures Open Interest (OI) has increased by 5% over the last 24 hours to $488.04 million, reflecting a buildup in positions. The OI-weighted funding rate at 0.0035%, up from 0.0011% on Monday, reflects a bullish incline in the positional buildup as traders are willing to hold long positions at a premium.
Will Cardano kick off a breakout rally to $0.30?
Cardano retains a capped tone as it holds beneath the 50-day EMA at $0.2555 and well below the 200-day EMA at $0.3658. The proximity of the descending resistance trendline break level at $0.2554 to the 50-day EMA reinforces a nearby supply cluster that limits upside attempts.
A decisive close above this zone could confirm the upside breakout of the symmetrical triangle pattern, targeting the April 17 high at $0.2680, followed by the $0.3000 round figure.
The Relative Strength Index (RSI) at 52 on the daily chart nudges above the neutral midline, reflecting a mild upside bias, while the Moving Average Convergence Divergence (MACD) remains marginally positive above its signal line, reaffirming modest underlying buying interest.
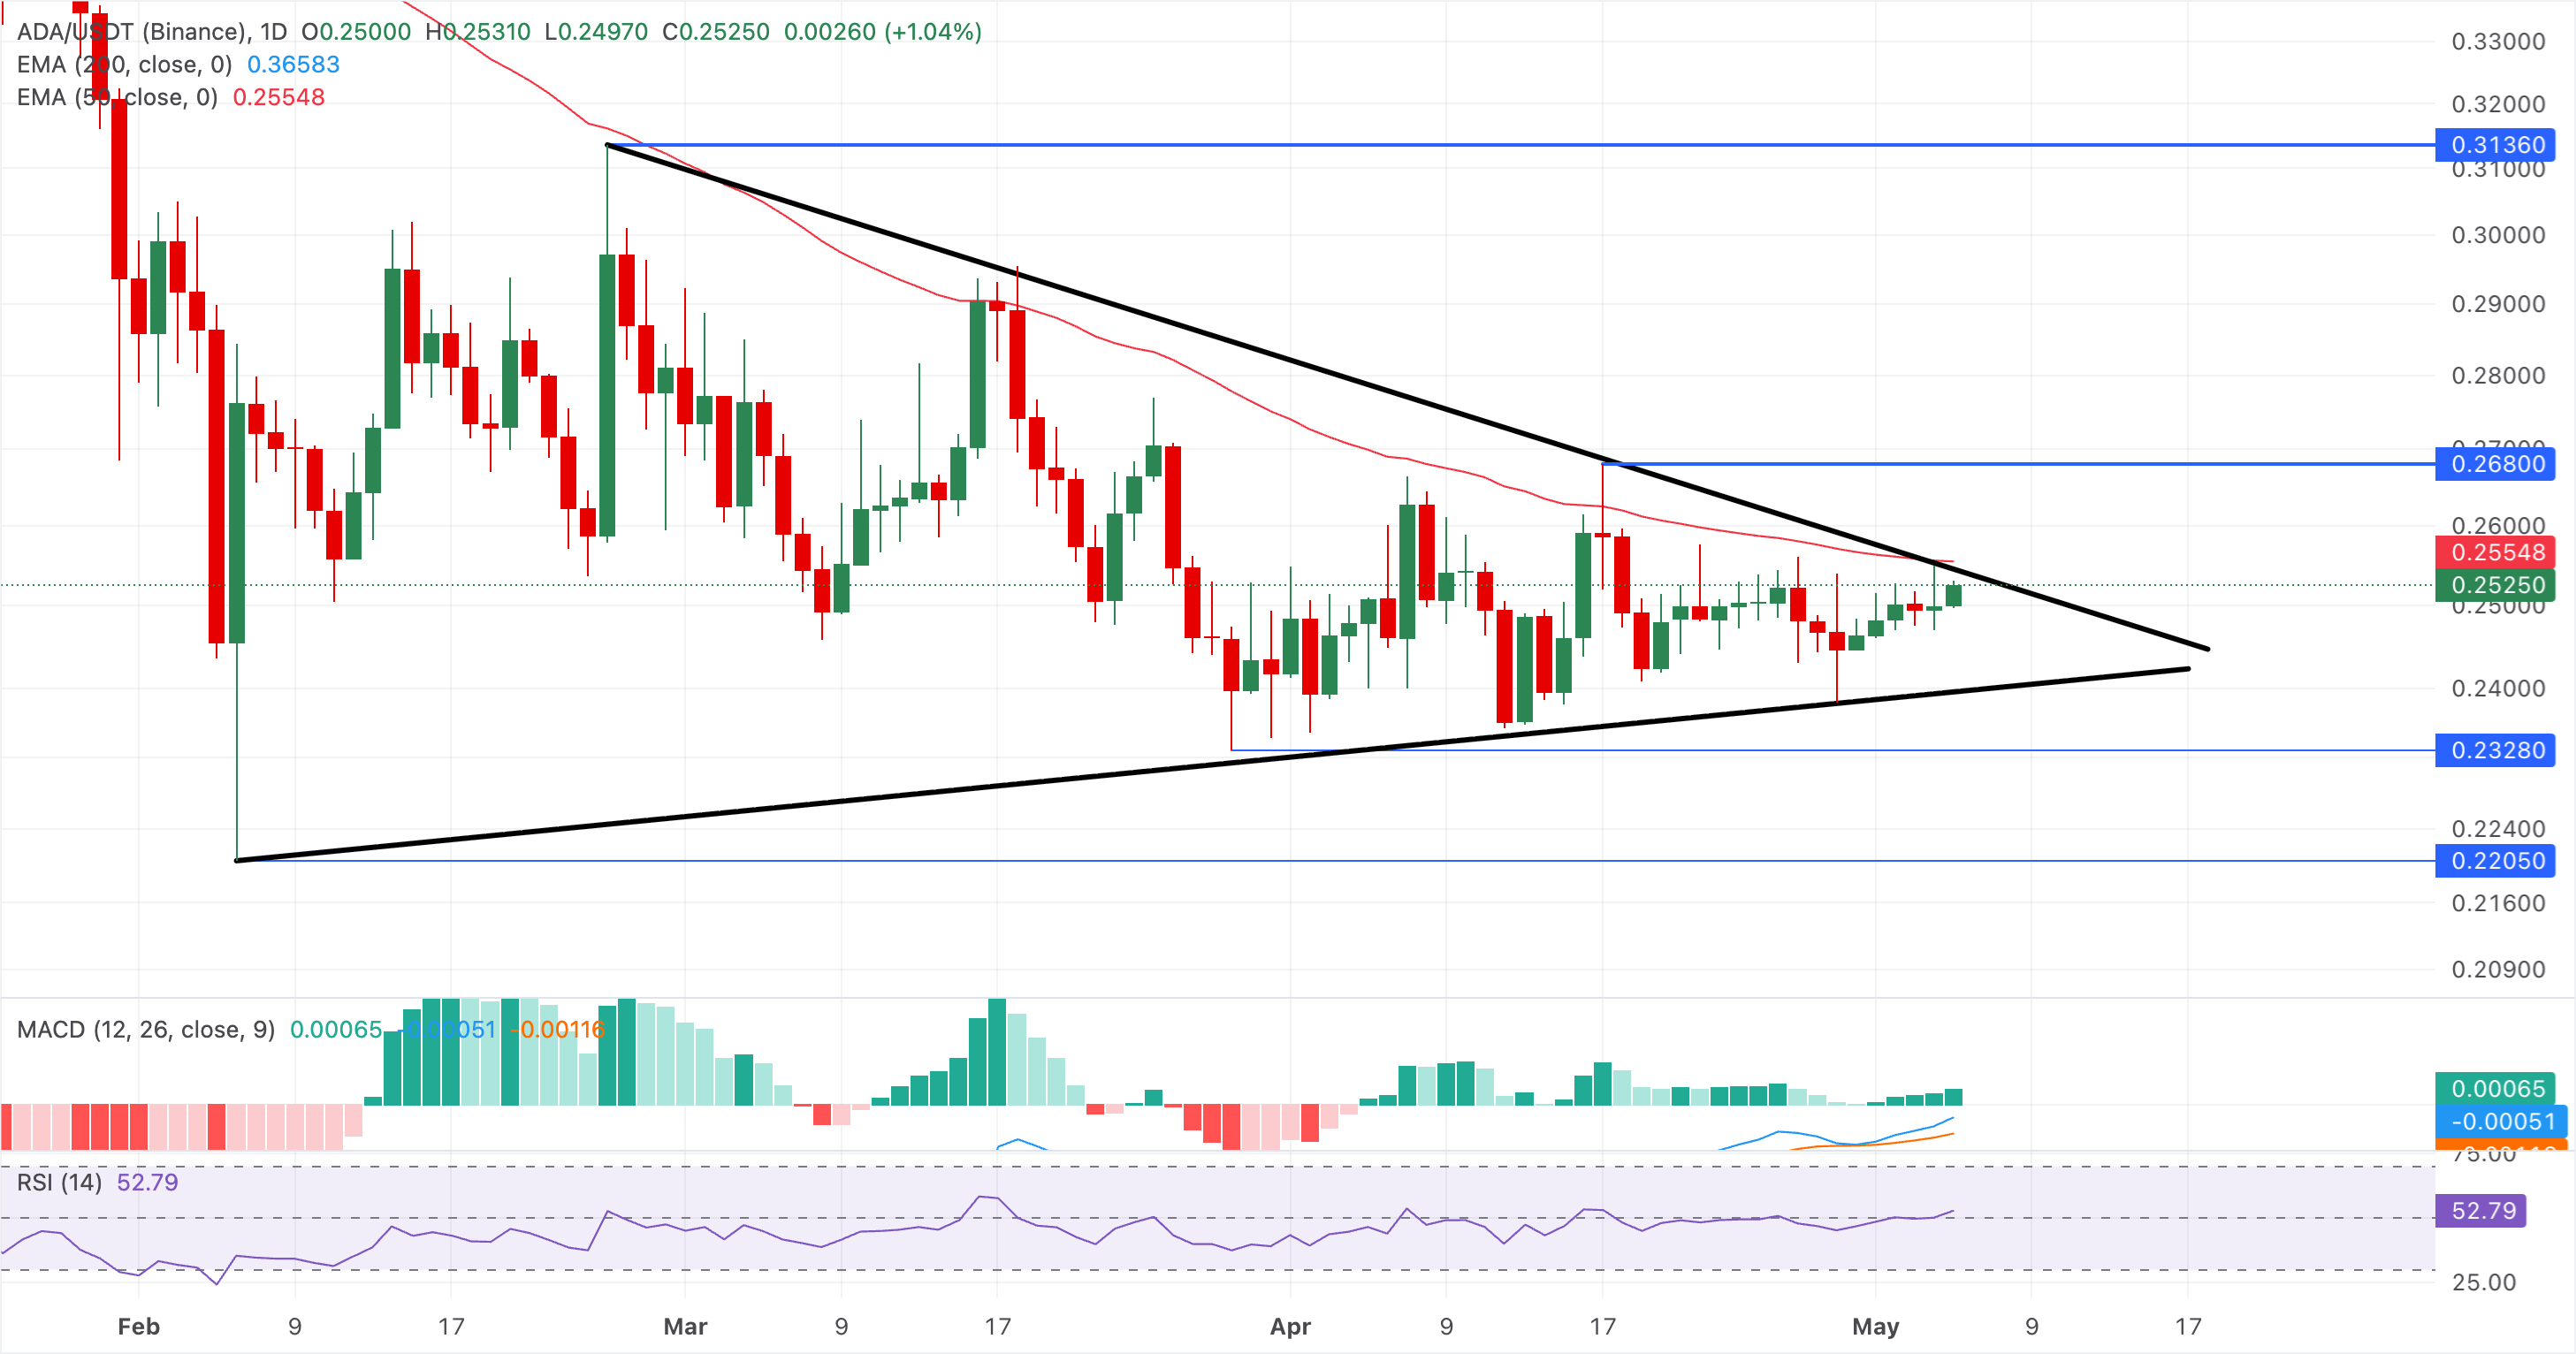
On the downside, initial support is outlined by the rising trendline break region around $0.2398, where a clear daily close below would expose the pair to a deeper corrective phase within the broader bearish structure.
(The technical analysis of this story was written with the help of an AI tool.)
Recommended Articles








Comments (0)
Click the $ button, enter the symbol, and select to link a stock, ETF, or other ticker.