


Solana Price Forecast: Challenges 50-day EMA as data and momentum hint at bullish shift



- Solana price near the key 50-day EMA at $86.10, a breakout above this level would signal a bullish move ahead.
- On-chain and derivatives data support a positive bias as cooling conditions alongside rising bets lift sentiment.
- The technical outlook shows momentum indicators flashing fading bearish pressure, hinting at a potential trend shift.
Solana (SOL) approaches key resistance on Tuesday, with bulls attempting to push the price above this critical hurdle at $86.10. Improving on-chain activity and derivatives metrics indicate strengthening sentiment. On the technical side, easing bearish momentum signals suggest that a breakout attempt could be gaining traction.
Solana’s on-chain and derivatives data support an upside move
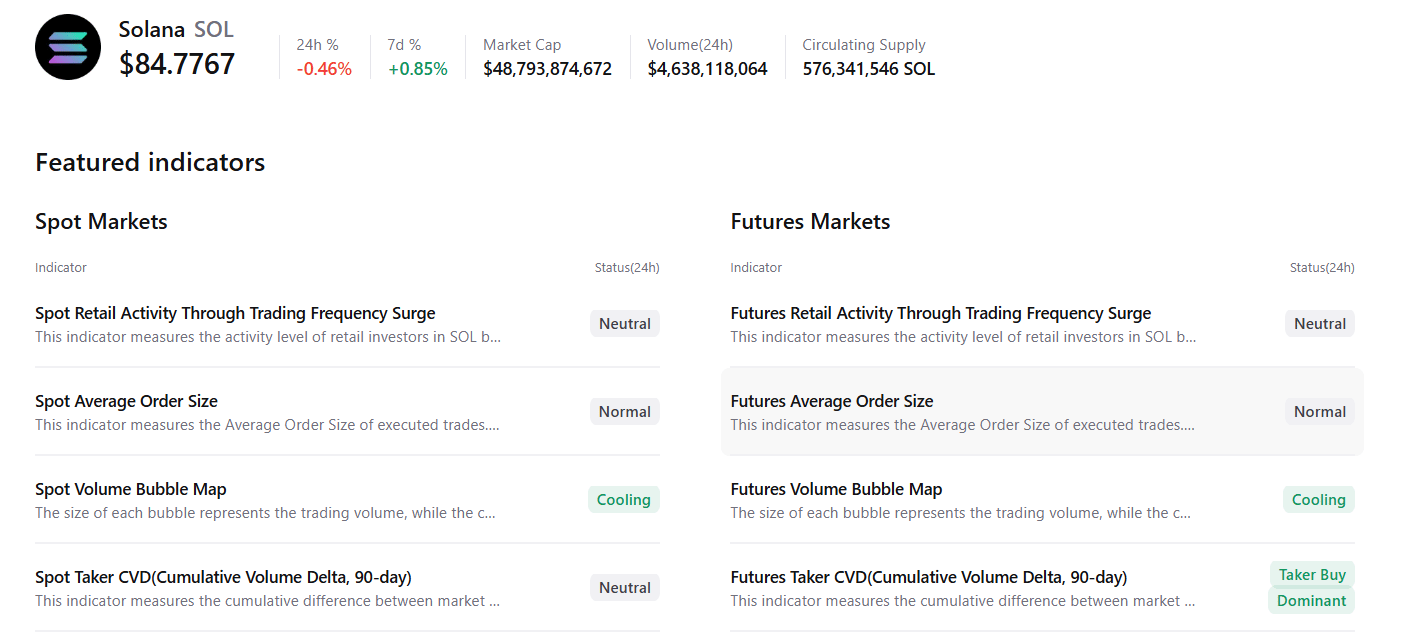
CryptoQuant summary data suggests a neutral to slightly bullish outlook for Solana. SOL’s XRP spot markets show cooling conditions, and futures markets show both cooling and buy-side dominance, with mostly neutral conditions across other metrics, suggesting a potential upside move.
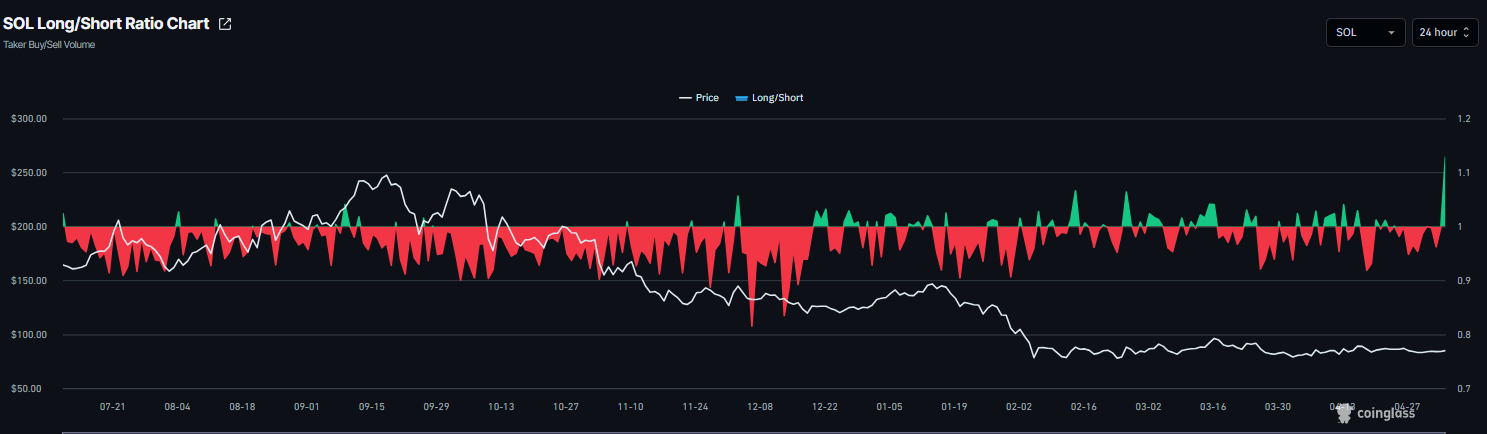
On the derivatives side, metrics tend to show a positive bias. CoinGlass’ long-to-short ratio for Solana reads 1.12 on Tuesday, the highest level over a month. This ratio, being above one, reflects bullish sentiment in the market, as more traders are betting on the asset’s price to rally.
Institutional demand shows early signs of optimism
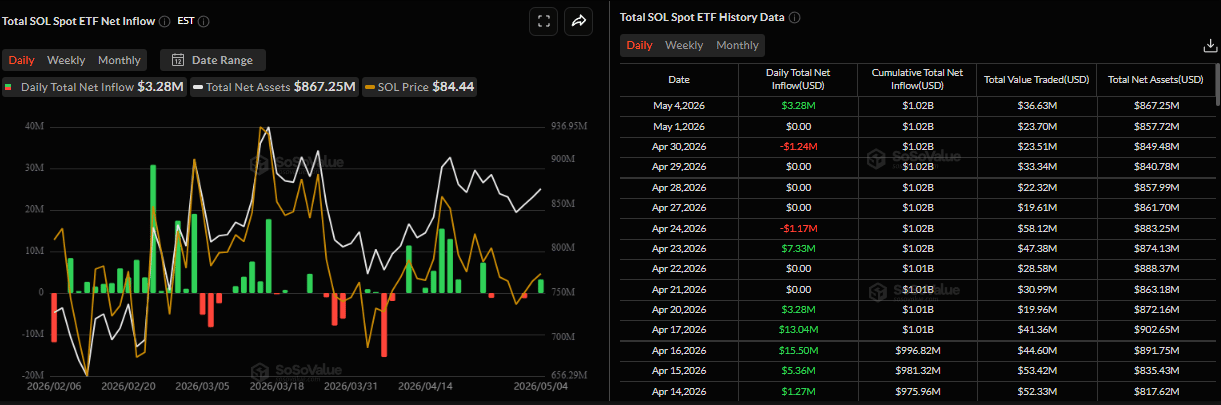
Institutional demand began the week on a positive note. SoSoValue data shows that spot Exchange Traded Funds (ETFs) recorded an inflow of $3.28 million on Monday, marking the first inflows since April 23. If this trend continues and intensifies this week, the Solana price could move higher.
Solana Price Forecast: SOL could extend gains if it closes above the 50-day EMA
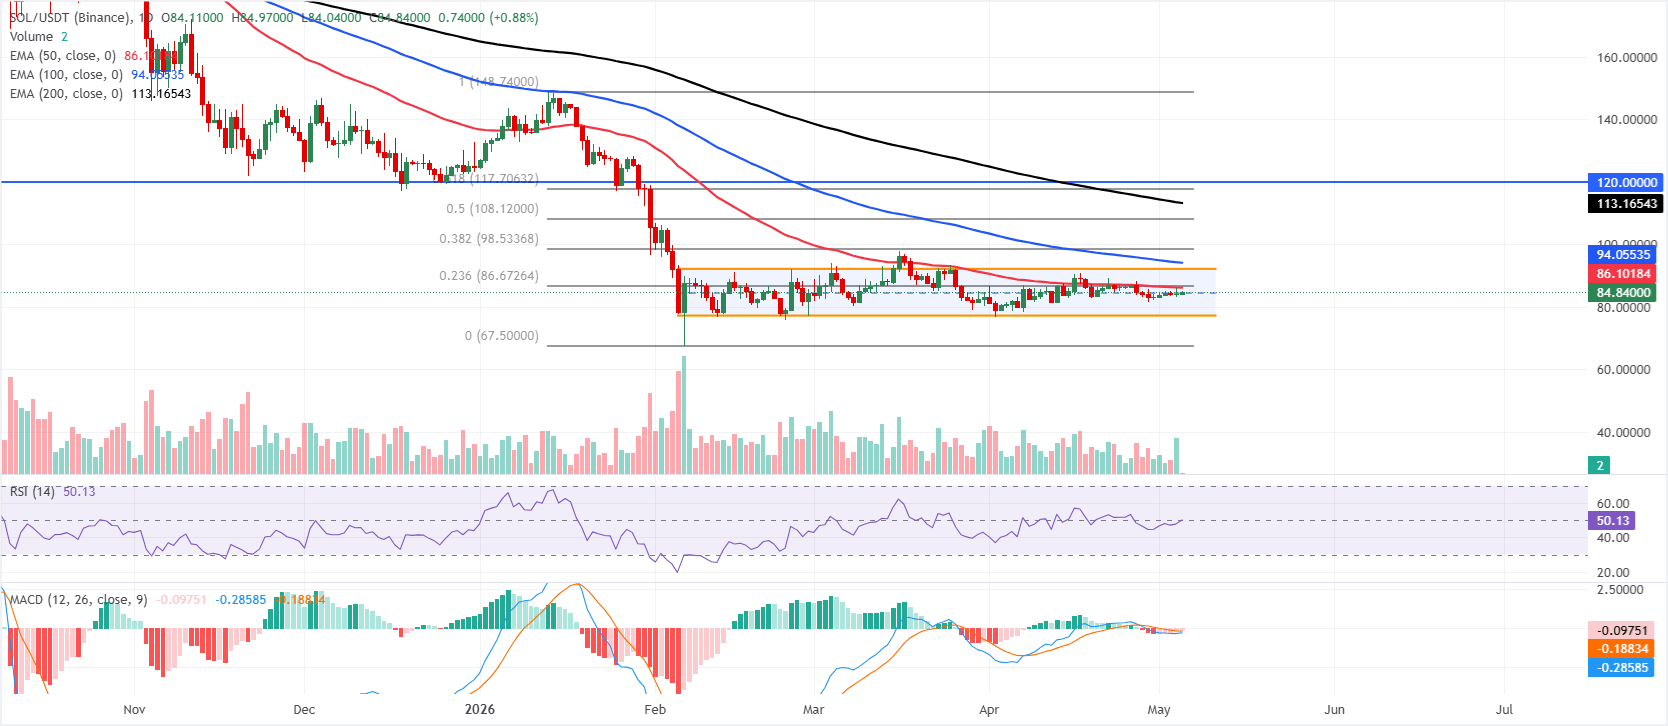
Solana price is trading at $84.82, holding a bearish near-term bias as it remains below a dense cap of Exponential Moving Averages and Fibonacci retracements. SOL price sits under the 50-day EMA at $86.10, with the 23.6% Fibonacci retracement of the latest swing located slightly higher at $86.67, reinforcing immediate overhead supply.
Momentum signals are mixed, with the Relative Strength Index (RSI) hovering around a neutral 50 and the Moving Average Convergence Divergence (MACD) slightly below zero, hinting at fading downside pressure.
On the topside, initial resistance is clustered around the 50-day EMA at $86.10 and the 23.6% Fibonacci retracement at $86.67, followed by the upper boundary of the horizontal parallel channel near $92.11. Higher up, the 100-day EMA at $94.05 and the 38.2% Fibonacci retracement at $98.53 precede more substantial barriers at the 50% retracement at $108.12 and the 200-day EMA at $113.17, with a horizontal line near $120.00 capping the broader recovery.
On the downside, the channel's lower boundary around $77.12 provides the first notable support, ahead of a more structural floor defined by the swing low anchor near $67.50, where buyers would be expected to show stronger interest if the current decline extends.
(The technical analysis of this story was written with the help of an AI tool.)
Recommended Articles








Comments (0)
Click the $ button, enter the symbol, and select to link a stock, ETF, or other ticker.