


Bitcoin Is In An Institutional Support Zone: Here Are The Three Metrics Funds Need Before They Jump In



Bitcoin is holding above $75,000 as the bullish momentum that drove it toward $79,000 over recent sessions has begun to slow. The recovery is real but not yet decisive — and as the market consolidates, a GugaOnChain report is drawing attention to a specific price zone that institutional participants appear to be watching with increasing focus.
The report identifies the $65,000 to $70,000 range as a zone of potential liquidity capture — the area where institutional accumulation has historically concentrated during corrective phases. With Bitcoin’s three-day pullback bringing that range back into realistic view, the framework for identifying whether smart money is actually positioning there has returned to the radar.
The analytical approach the report outlines is not a single signal but a convergence of three. The first rests on a metric that measures retail pain. When recent Bitcoin buyers are forced to sell at a loss — when the holders who bought in the past few months are capitulating at prices below their entry — the STH-SOPR falls below 1.0. That reading is not merely a bearish signal. It is the specific condition that has historically marked the moment when institutional participants begin filling positions, absorbing the cheap liquidity that retail panic produces.
The bleeding of weak hands and the buying of smart money are not opposites. In markets, they tend to happen at the same time, and identifying when they are occurring simultaneously is the framework the report is built around.
Two More Signals. When All Three Align, the Move Becomes Inevitable
The STH-SOPR reading confirms retail pain. But pain alone is not enough to validate institutional accumulation — it must be accompanied by the capital and the positioning that transforms a support test into a directional shock. The second and third pillars of the GugaOnChain framework provide those confirmations.
The stablecoin supply ratio tracks the firepower waiting on the sidelines. When large inflows of USDT arrive on Binance — the exchange that processes the largest share of global Bitcoin volume — it signals that institutional capital has been loaded and is ready to deploy.
That influx must coincide with a specific divergence in order flow: retail traders opening leveraged short positions in derivatives while institutions silently accumulate the actual asset in spot markets. The CVD captures that split in real time. When derivatives show aggressive shorting while spot buying quietly dominates, the structure for a squeeze is forming beneath the surface.
The funding rate completes the picture and provides the trigger. When the 30-day funding rate reaches persistent negative readings between -0.015% and -0.020%, short sellers have become dangerously overleveraged. They have borrowed heavily to bet against the price — and in doing so, they have created the directional fuel that makes a violent short squeeze not just possible but mechanically inevitable when institutional buying begins in earnest.

The convergence of all three — retail capitulation in spot, stablecoin firepower confirmed on Binance, and extreme negative funding guaranteeing overleveraged shorts — is the framework that filters noise from signal. When they align simultaneously, the directional shock the report describes does not arrive gradually. It arrives all at once.
Bitcoin Tests Range High As Recovery Meets Overhead Resistance
Bitcoin is trading around $76,000, pressing into a resistance zone that has repeatedly capped upside attempts since the February breakdown. After establishing a base between $64,000 and $68,000, the price has trended higher in a controlled recovery, forming a sequence of higher lows that reflects improving short-term structure. However, that recovery is now confronting a critical inflection point.
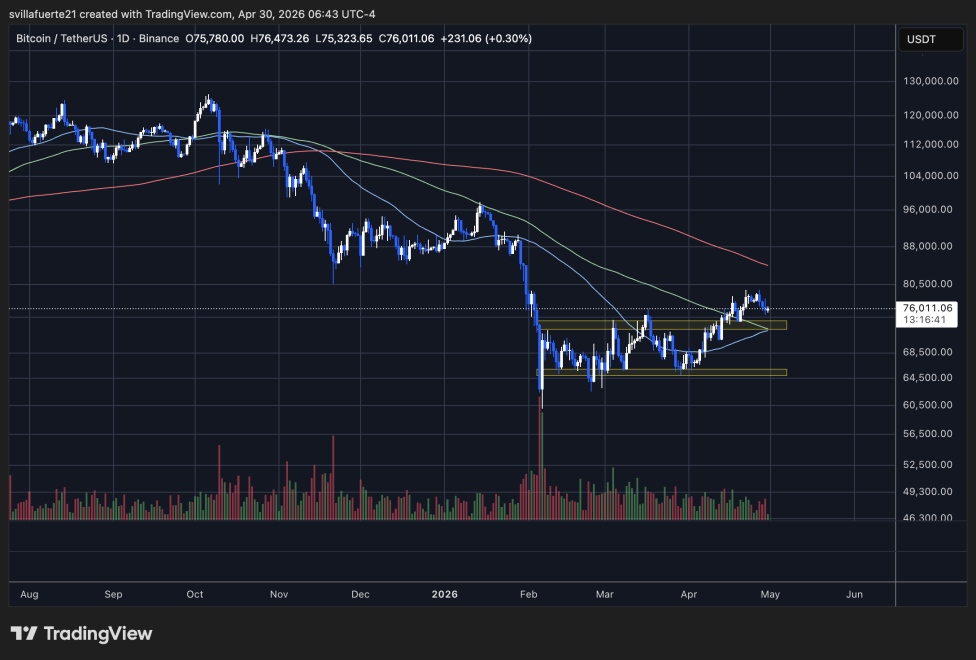
The $74,000–$76,000 region stands out as a clear supply zone. It previously acted as support before the breakdown and is now functioning as resistance, with multiple rejections confirming the presence of sellers. This aligns with the 100-day and 200-day moving averages, both trending downward and converging above the current price, reinforcing the broader bearish bias.
Momentum is slowing as the price approaches this level. Recent candles show smaller bodies and reduced follow-through, suggesting that buyers are losing strength as they encounter overhead supply. Volume patterns support this interpretation. The spike during the February selloff marked capitulation, but the subsequent recovery has occurred on relatively moderate volume, indicating limited conviction behind the move.
Structurally, Bitcoin remains range-bound between $64,000 support and $76,000 resistance. A decisive break above this zone would shift momentum and open a move toward $80,000, while rejection here risks a rotation back into the lower range.
Featured image from ChatGPT, chart from TradingView.com
Recommended Articles








Comments (0)
Click the $ button, enter the symbol, and select to link a stock, ETF, or other ticker.