


Dogecoin Price Forecast: DOGE flashes bullish signal as momentum builds



- Dogecoin extends gains for the fourth consecutive day, building bullish momentum.
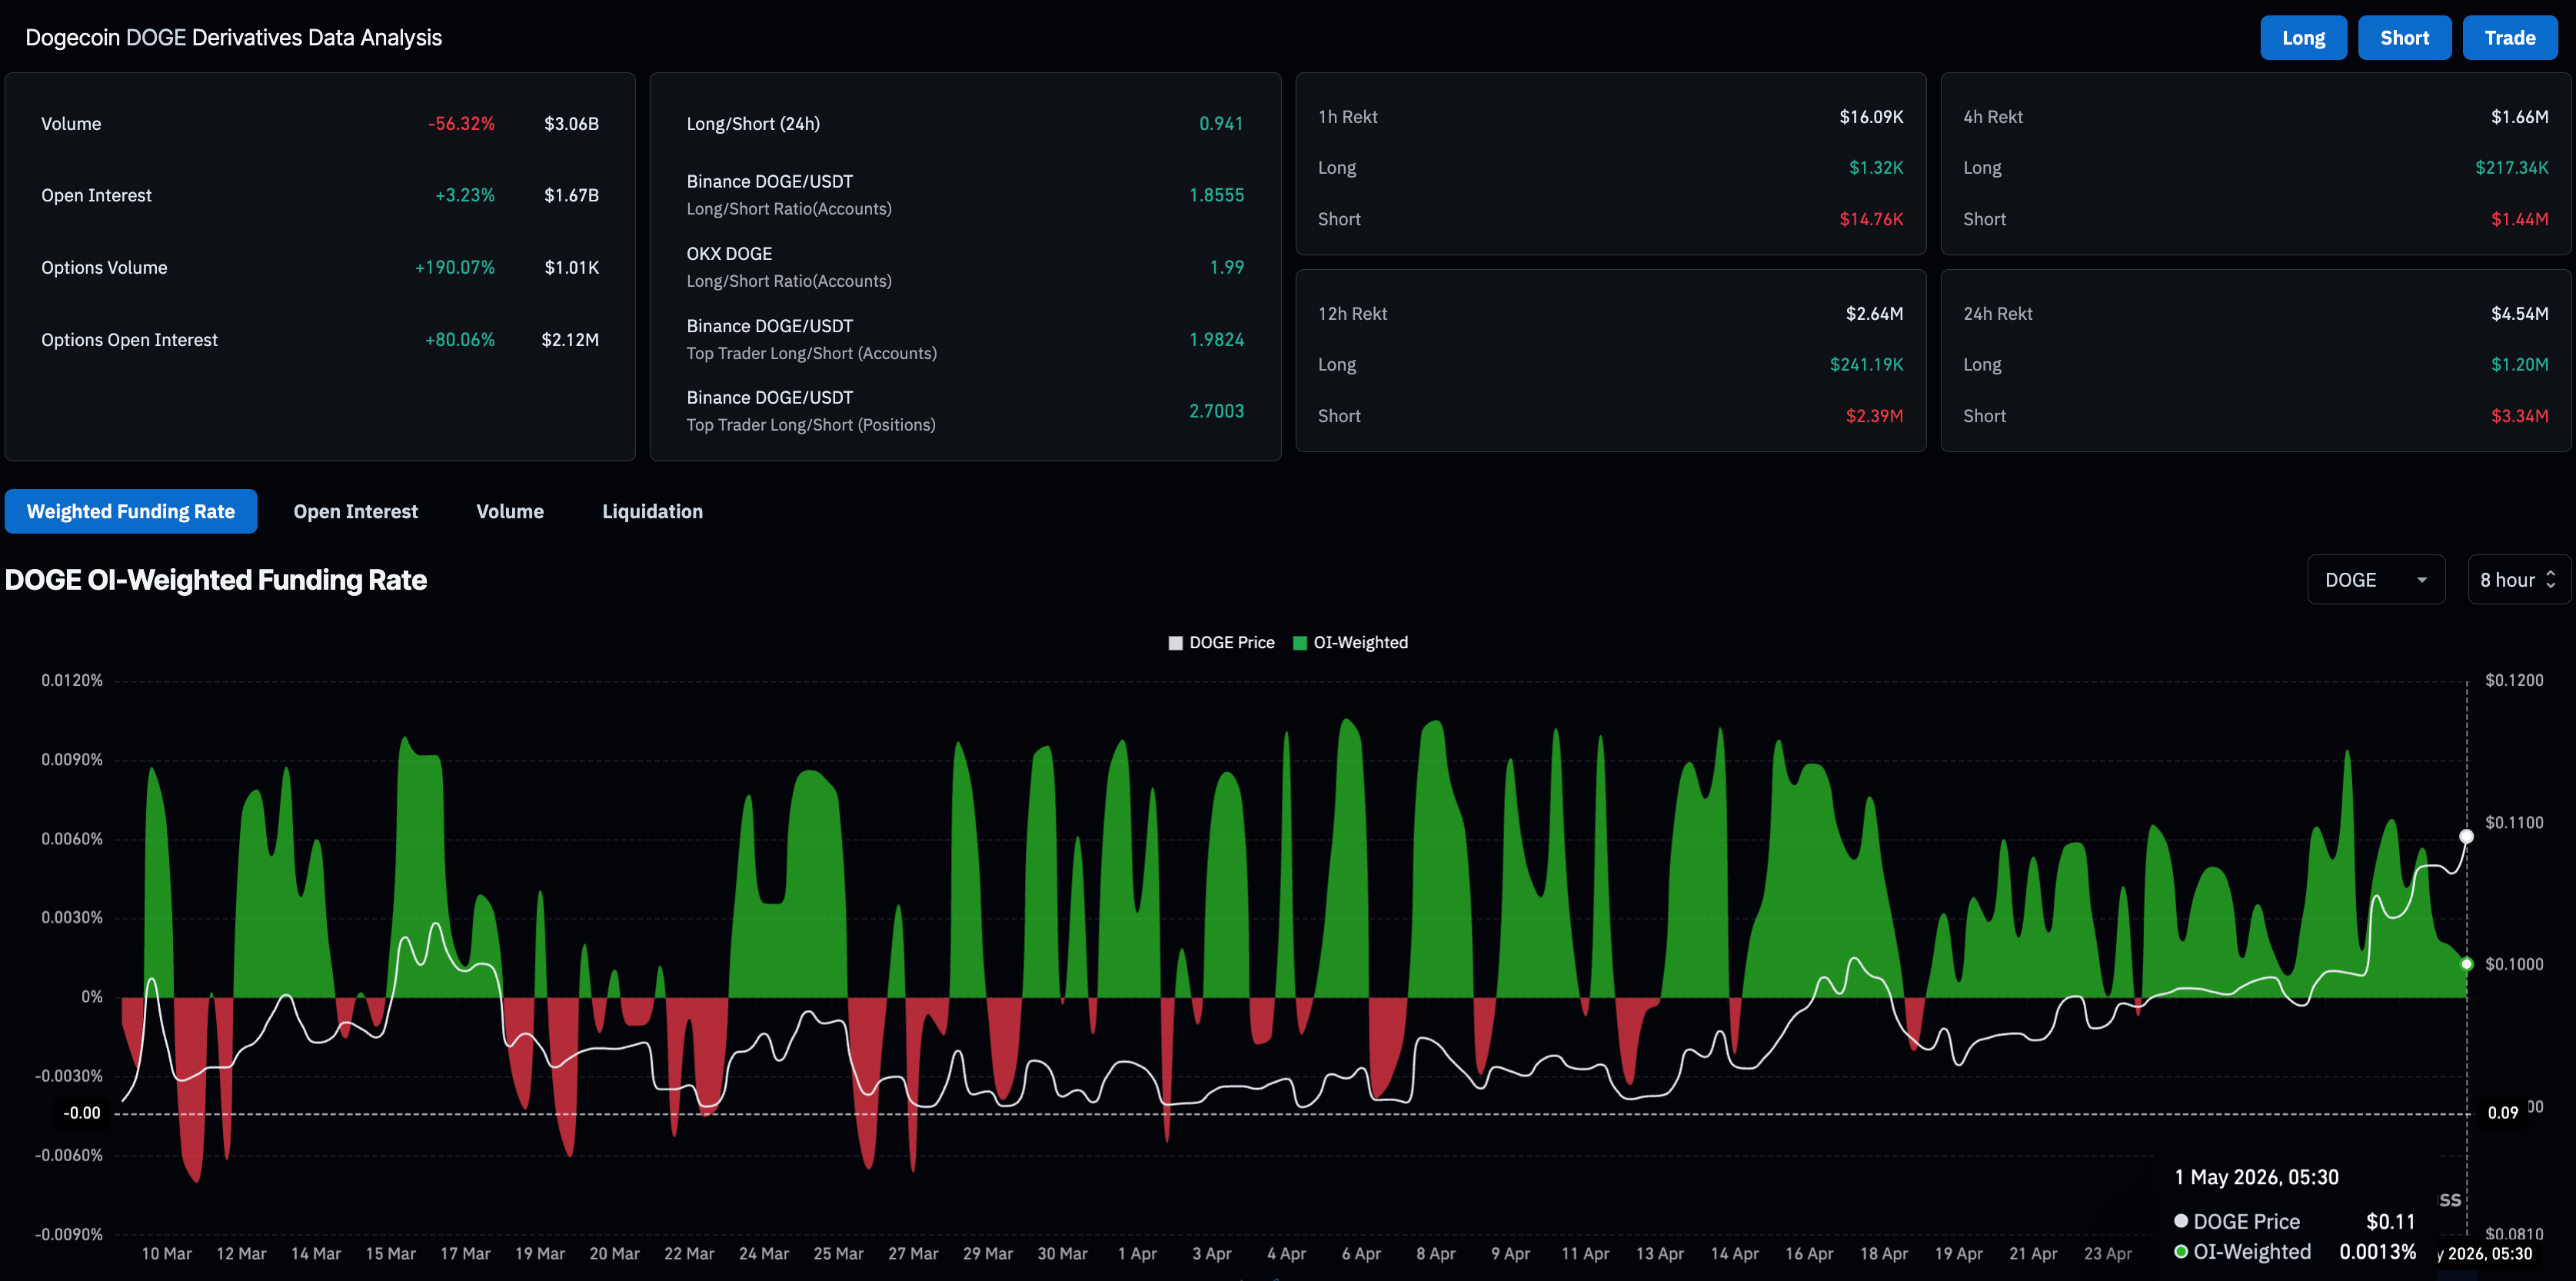
- DOGE futures market regains leverage-linked retail demand, pushing Open Interest to $1.67 billion.
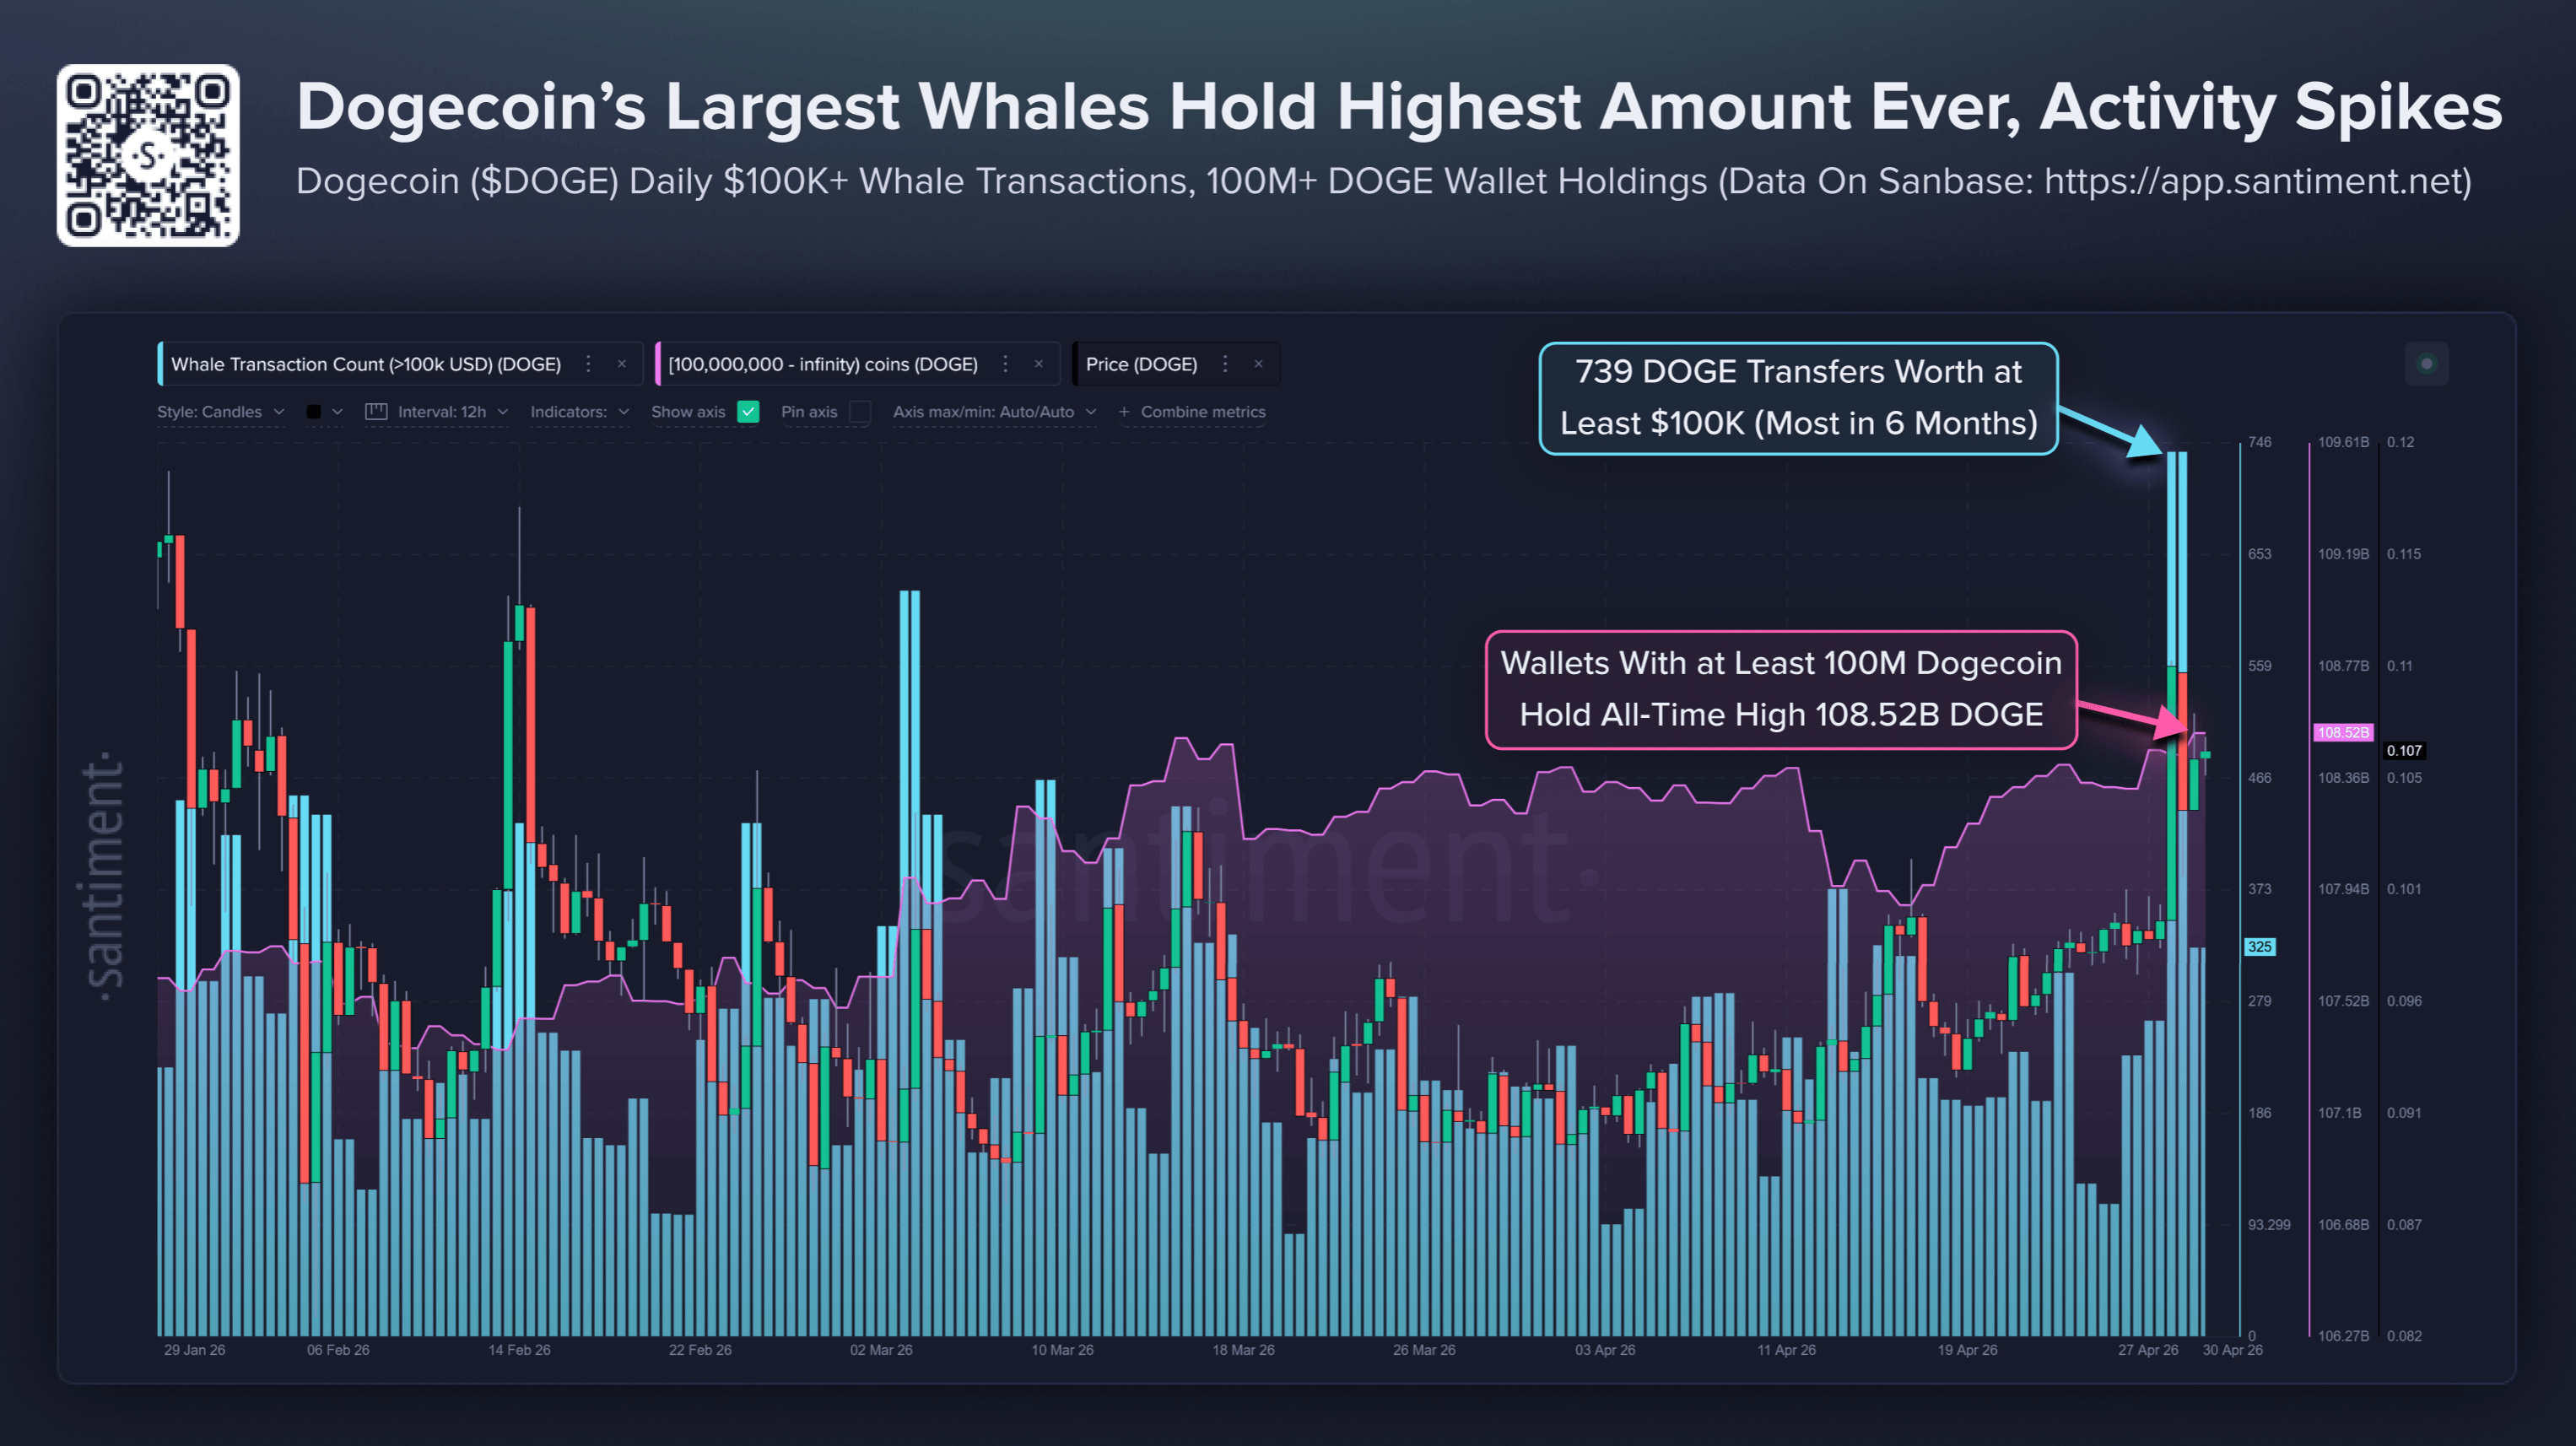
- On-chain data shows whale activity at a 6-month high on Thursday, reflecting intense interest from large wallet investors.
Dogecoin (DOGE) trades above $0.1000 at press time on Friday, building bullish momentum within its fourth straight day and having registered roughly 10% gains so far this week. The meme coin is gaining retail traction in the leverage market and among large wallet investors, commonly known as whales, fueling a short-term recovery.
Dogecoin regains market interest and whales’ attention
The demand for Dogecoin is rising across spot and derivatives markets amid increased whale activity, which typically signals a segment rotation to meme coins. CoinGlass data shows the DOGE futures Open Interest (OI) is up over 3% in the last 24 hours to $1.67 billion, reflecting increased positional buildup. At the same time, the funding rate remains positive at 0.0013%, down from 0.0057% on Thursday, suggesting reduced bullishness among buyers holding long positions, thereby reducing the premium.
Santiment data shows that on-chain activity by Dogecoin whales reached a 6-month high on Thursday, with 739 transfers of over $100,000 in value. Meanwhile, 149 whale wallets holding more than 100 million Dogecoin expanded their portfolio to an all-time high of 108.52 billion DOGE, reaffirming the strong interest from large wallet investors.
How high will Dogecoin go?
Dogecoin holds a bullish near‑term bias as price holds above both the 50-day and 100-day EMAs at $0.0975 and $0.1046, respectively, while only the 200-day EMA at $0.1239 remains overhead as a broader trend cap. Momentum is strong, with the Relative Strength Index (RSI) near 74 on the daily chart, in overbought territory, and the Moving Average Convergence Divergence (MACD) line extending above the signal line in positive territory as bullish histograms expand, which suggests persistent upside pressure but also raises the risk of a corrective pullback.
On the topside, initial resistance lies between the December 31 low at $0.1161 and the 200-day EMA around $0.1239. A clear break above this barrier would further reinforce the broader bullish structure, targeting the January 6 high at $0.1565.
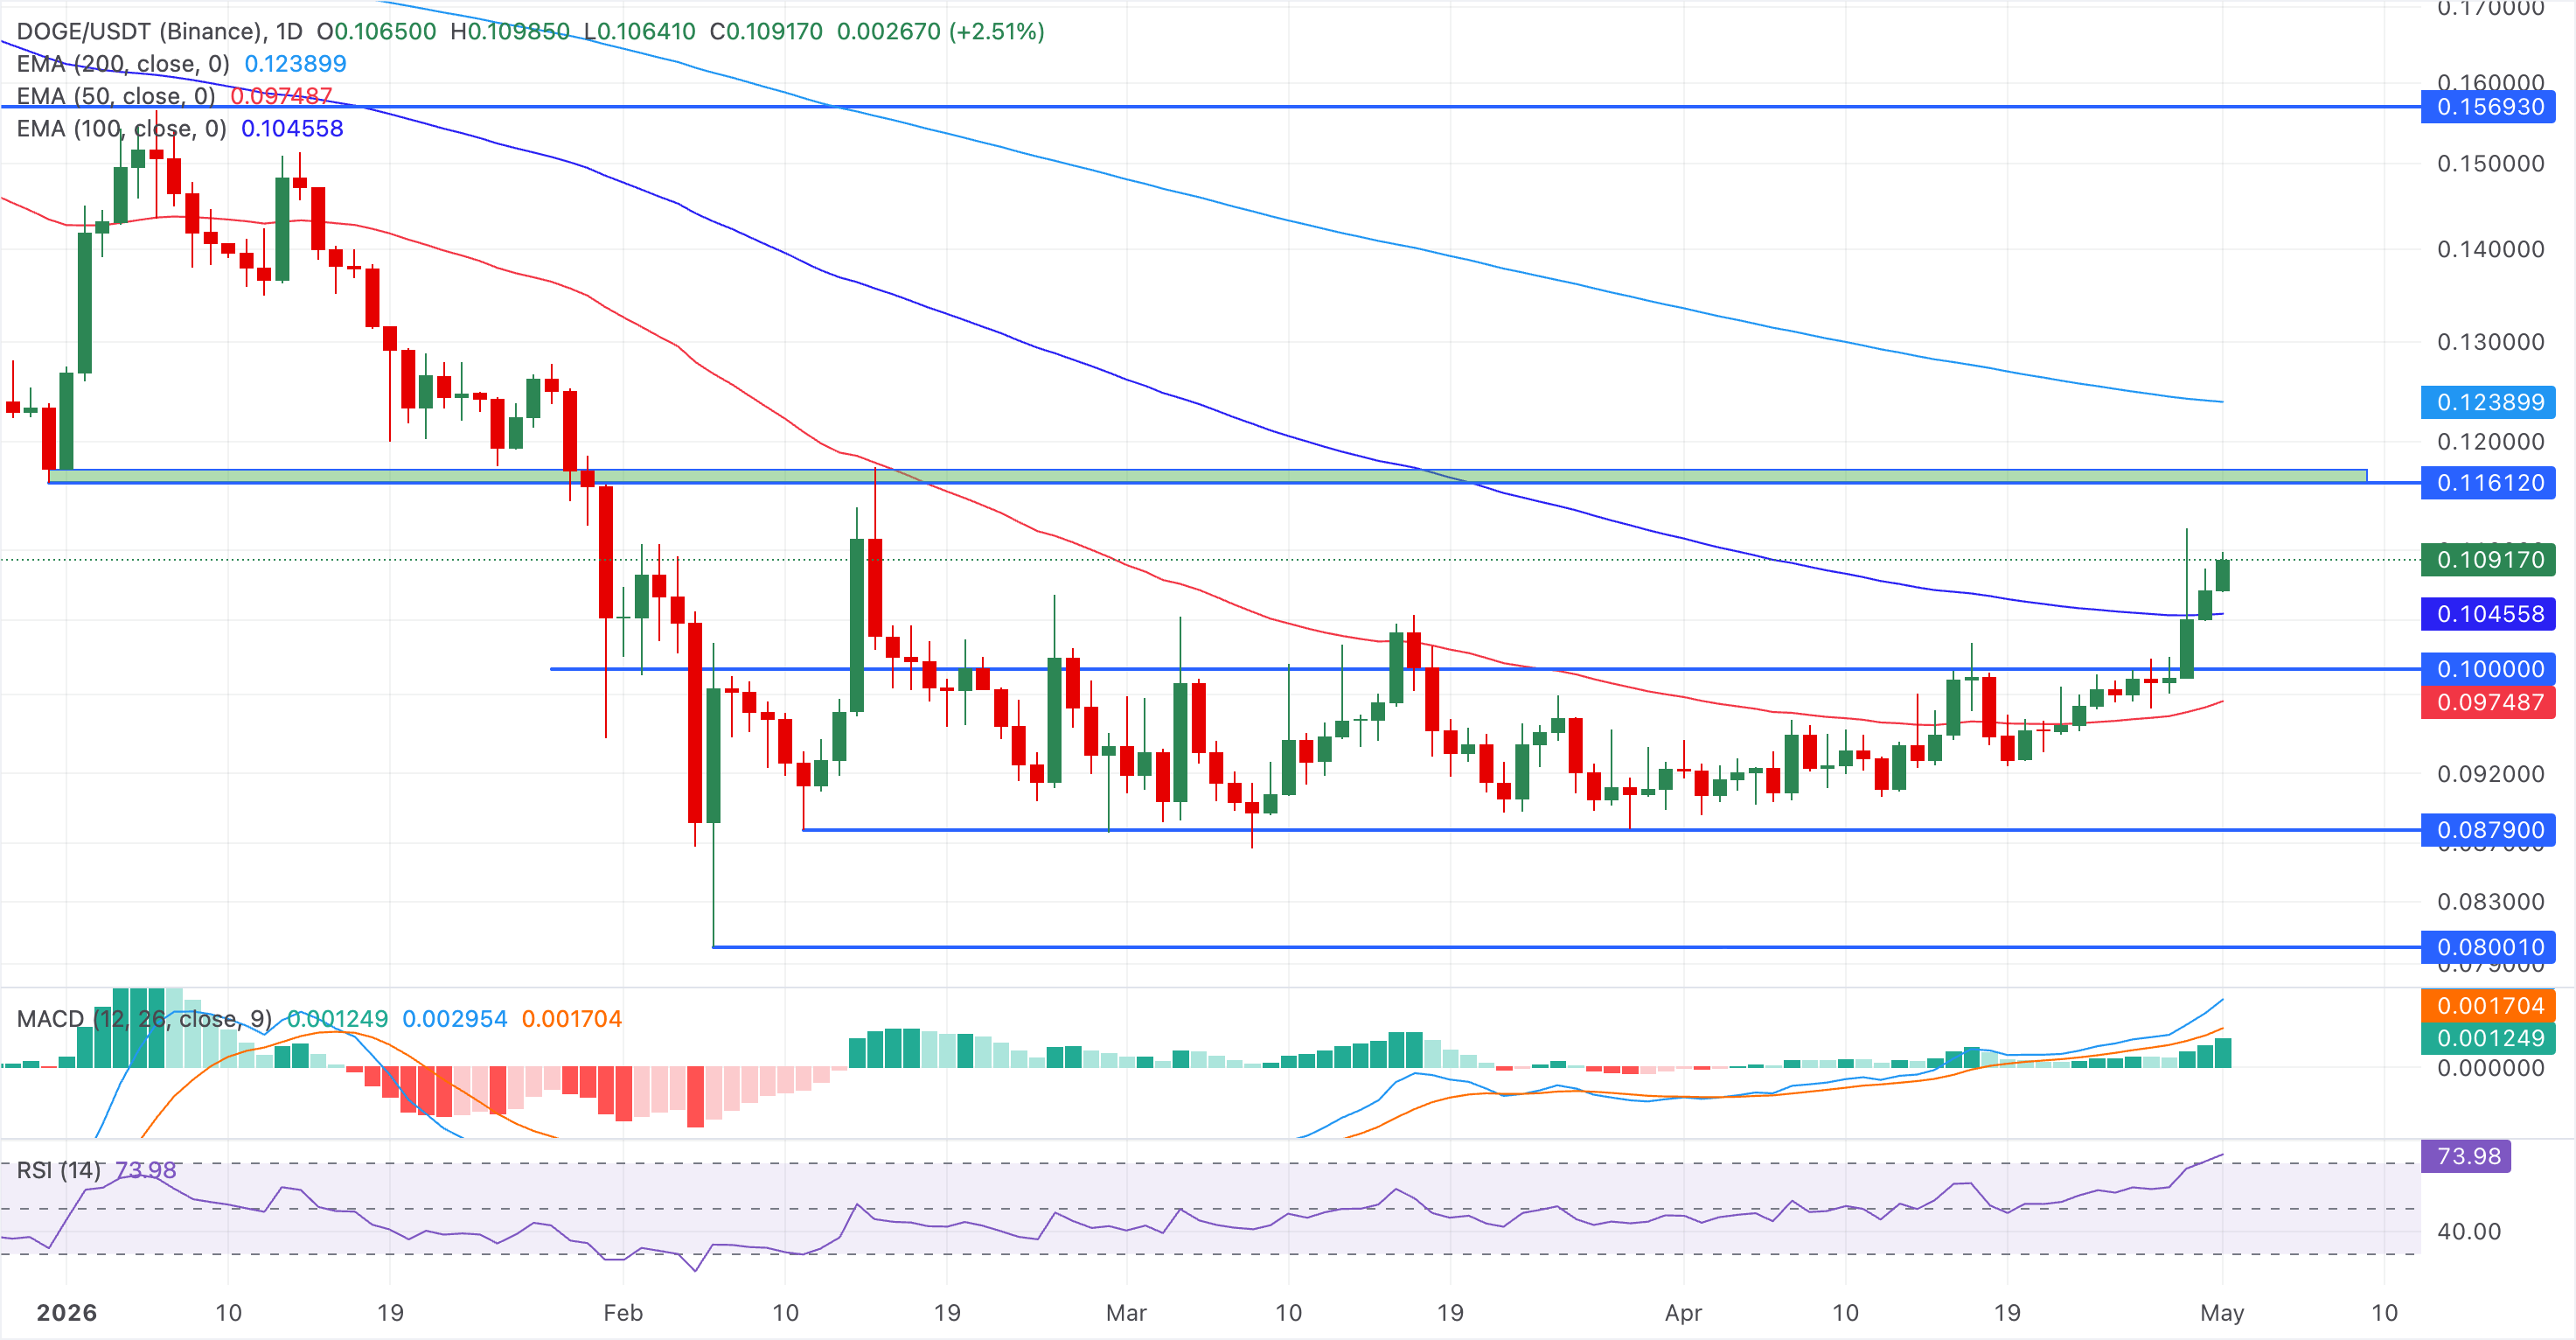
On the downside, immediate intraday attention sits on the 100-day EMA at $0.1046, providing the first notable layer of technical support, followed by the $0.1000 psychological mark, close to the 50-day EMA at $0.0975, where buyers would be expected to re-emerge on deeper dips.
(The technical analysis of this story was written with the help of an AI tool.)
Recommended Articles








Comments (0)
Click the $ button, enter the symbol, and select to link a stock, ETF, or other ticker.