


Pi Network Price Forecast: PI defends key support amid intense selling



- Pi Network shows early signs of recovery from its 50-day EMA after two consecutive days of losses.
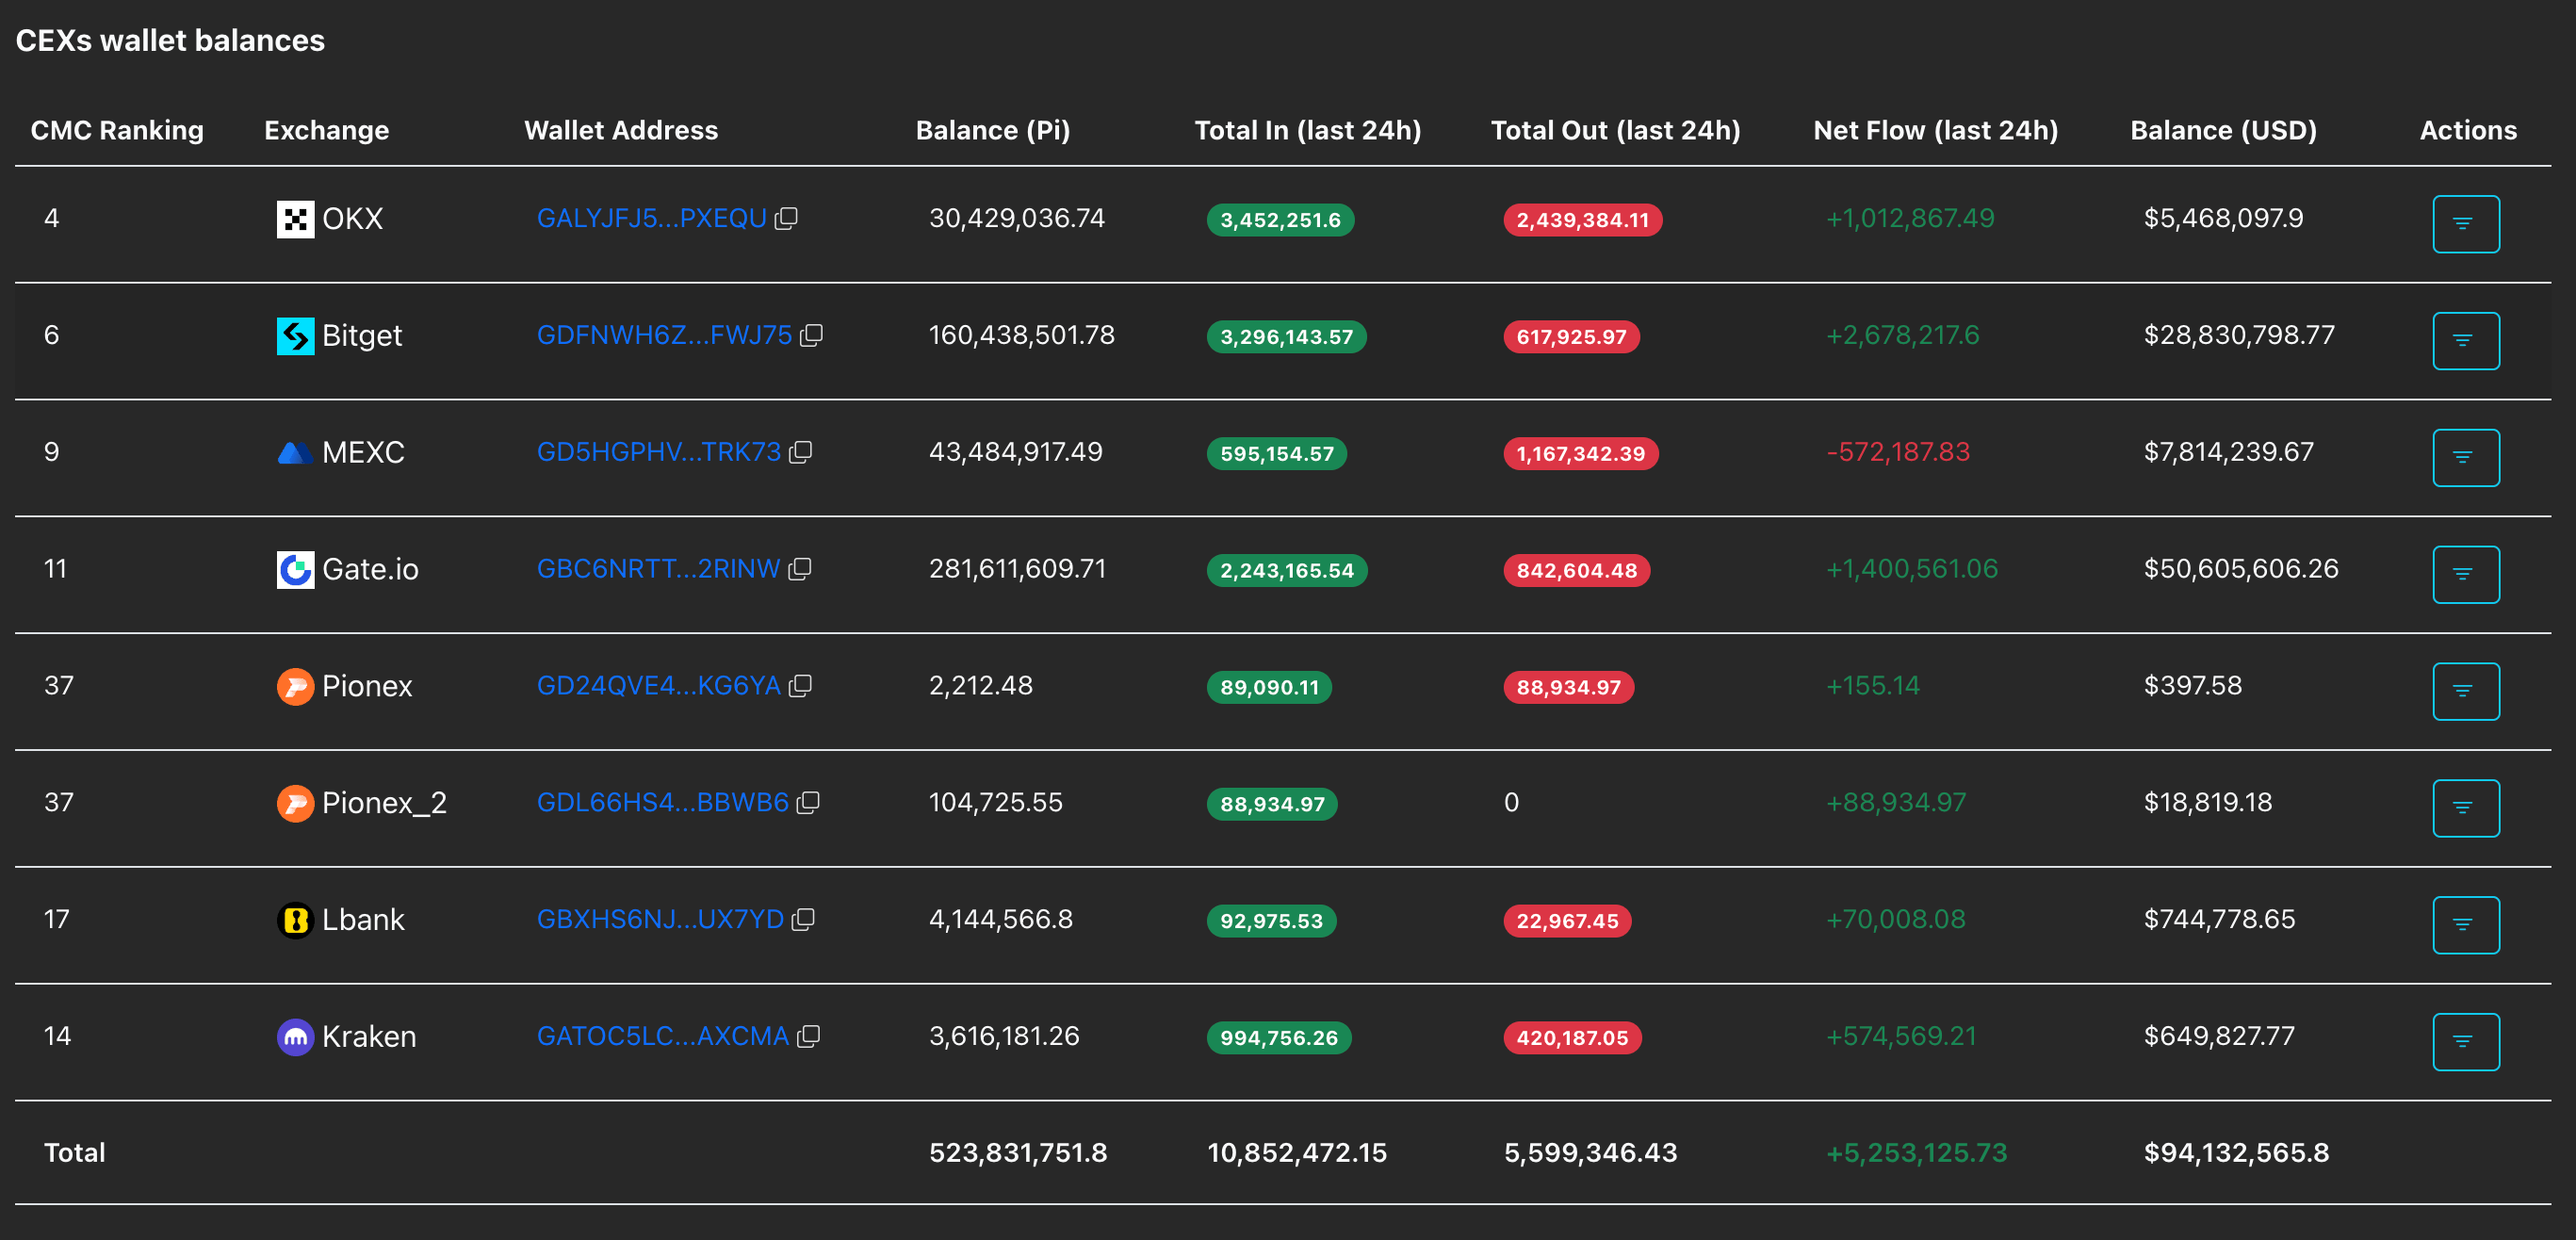
- Roughly over 5 million PI tokens were deposited on CEXs in 24 hours, indicating intense selling pressure.
- The technical outlook is bearish, with pressure building on the 50-day EMA at $0.1782.
Pi Network (PI) extends gains above $0.1800 at press time on Friday, reflecting early signs of recovery after two straight days of losses. Massive deposits of over 5 million Pi tokens on Centralized Exchanges (CEXs) in the last 24 hours align with the 6% decline on the previous day. The technical outlook flashes a bearish signal as recovery at the 50-day Exponential Moving Average (EMA) at $0.1782 remains weak.
Investor confidence weakens in PI
Pi Network is losing investor interest as the second mainnet migration phase unlocks additional supply transfers from the testnet, enabling holders to deposit PI tokens on CEXs. PiScan data shows 5.25 million PI tokens were deposited on CEXs, signaling a sell-off phase among investors.
Will Pi Network hold ground at the 50-day EMA?
Pi Network shows short-term recovery above $0.1800 at press time on Friday, holding a capped tone as it sits above the 50-day EMA at $0.1782.
The 100-day EMA at $0.1852 keeps the broader downtrend in play, even as the Moving Average Convergence Divergence (MACD) stays in positive territory above its signal line and the Relative Strength Index (RSI) at 53 hovers just above the midline, hinting at only modest bullish momentum within a still-constrained setup.
On the topside, initial resistance is seen at the 100-day EMA at $0.1852 and the $0.2000 psychological level, while the more distant 200-day EMA near $0.2328 marks a major barrier for any sustained recovery.
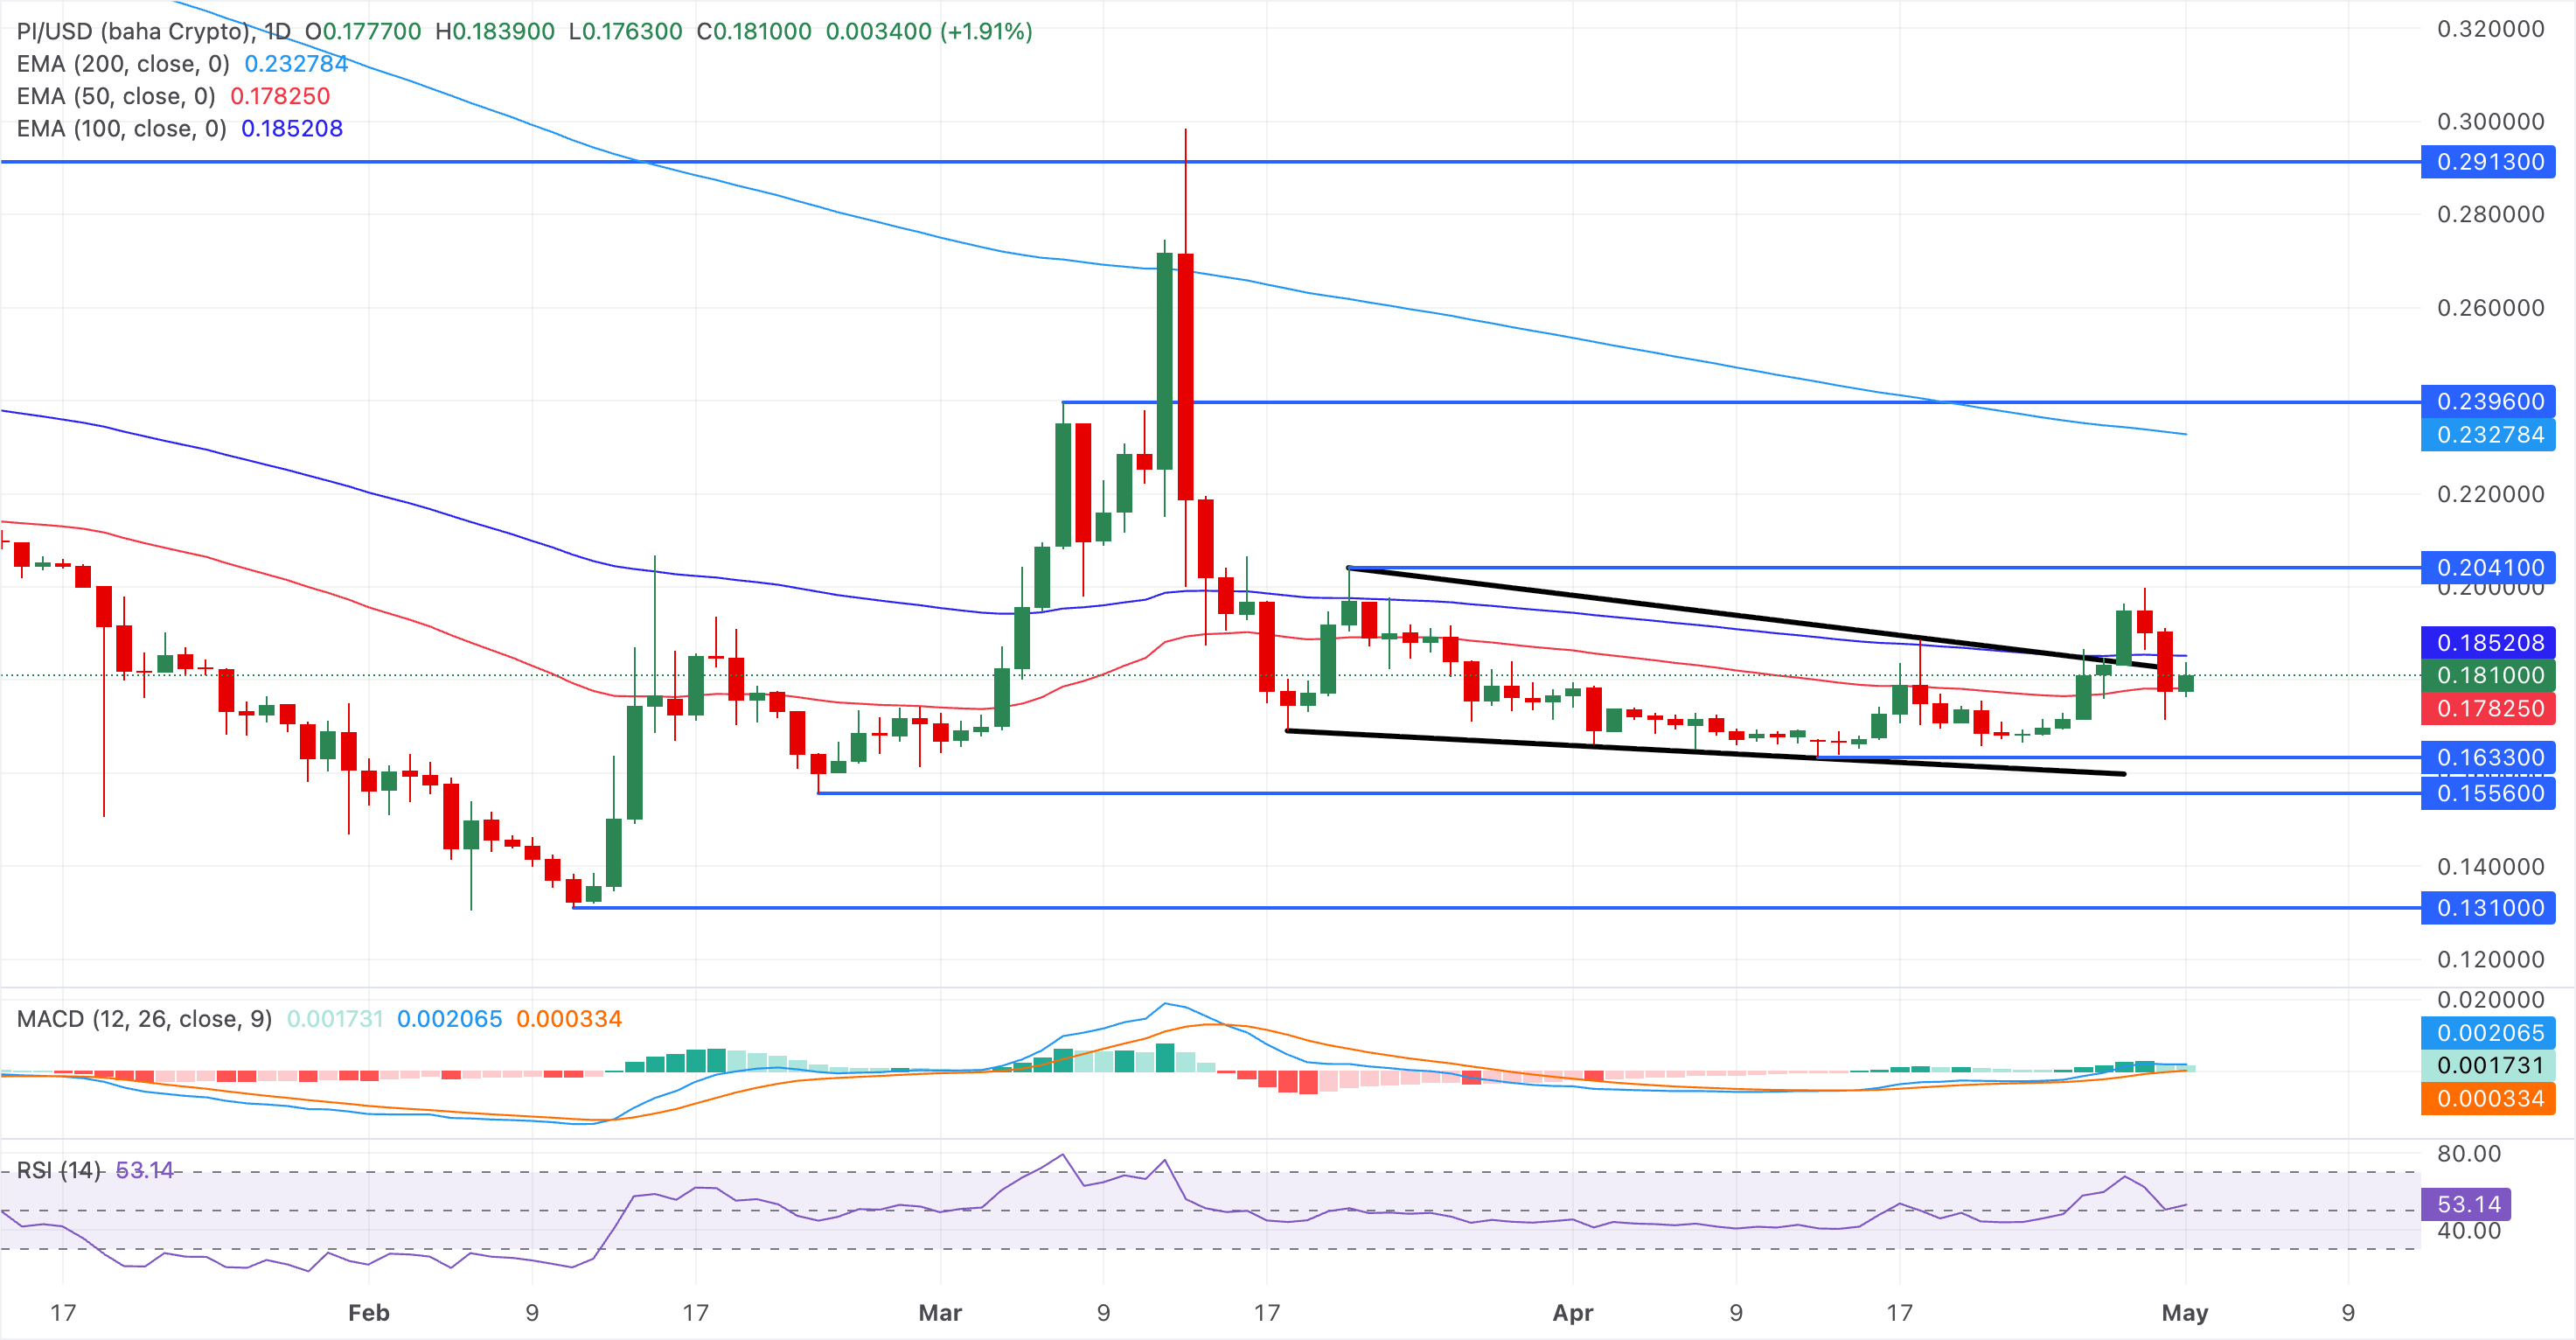
On the downside, immediate support is provided by the 50-day EMA around $0.1782, and a clear break beneath this floor would expose the recent lows and signal that sellers are regaining control despite the mildly constructive momentum readings.
(The technical analysis of this story was written with the help of an AI tool.)
Recommended Articles








Comments (0)
Click the $ button, enter the symbol, and select to link a stock, ETF, or other ticker.