


Pepe Price Forecast: Retail interest builds as PEPE tests key trendline breakout



- Pepe edges higher on Wednesday, testing a key resistance area near $0.0000040.
- Renewed retail interest in PEPE aligns with increased activity in the derivatives market.
- The technical outlook for Pepe is cautiously bullish as the price tests a key trendline breakout.
Pepe (PEPE) is gaining strength at press time on Wednesday, edging higher toward a key resistance area near $0.00000400. Retail interest in the frog-themed meme coin is rising alongside leverage-linked trading activity in PEPE futures. The technical outlook is bullish as the price tests a crucial trendline resistance breakout.
Retail demand for Pepe heats up
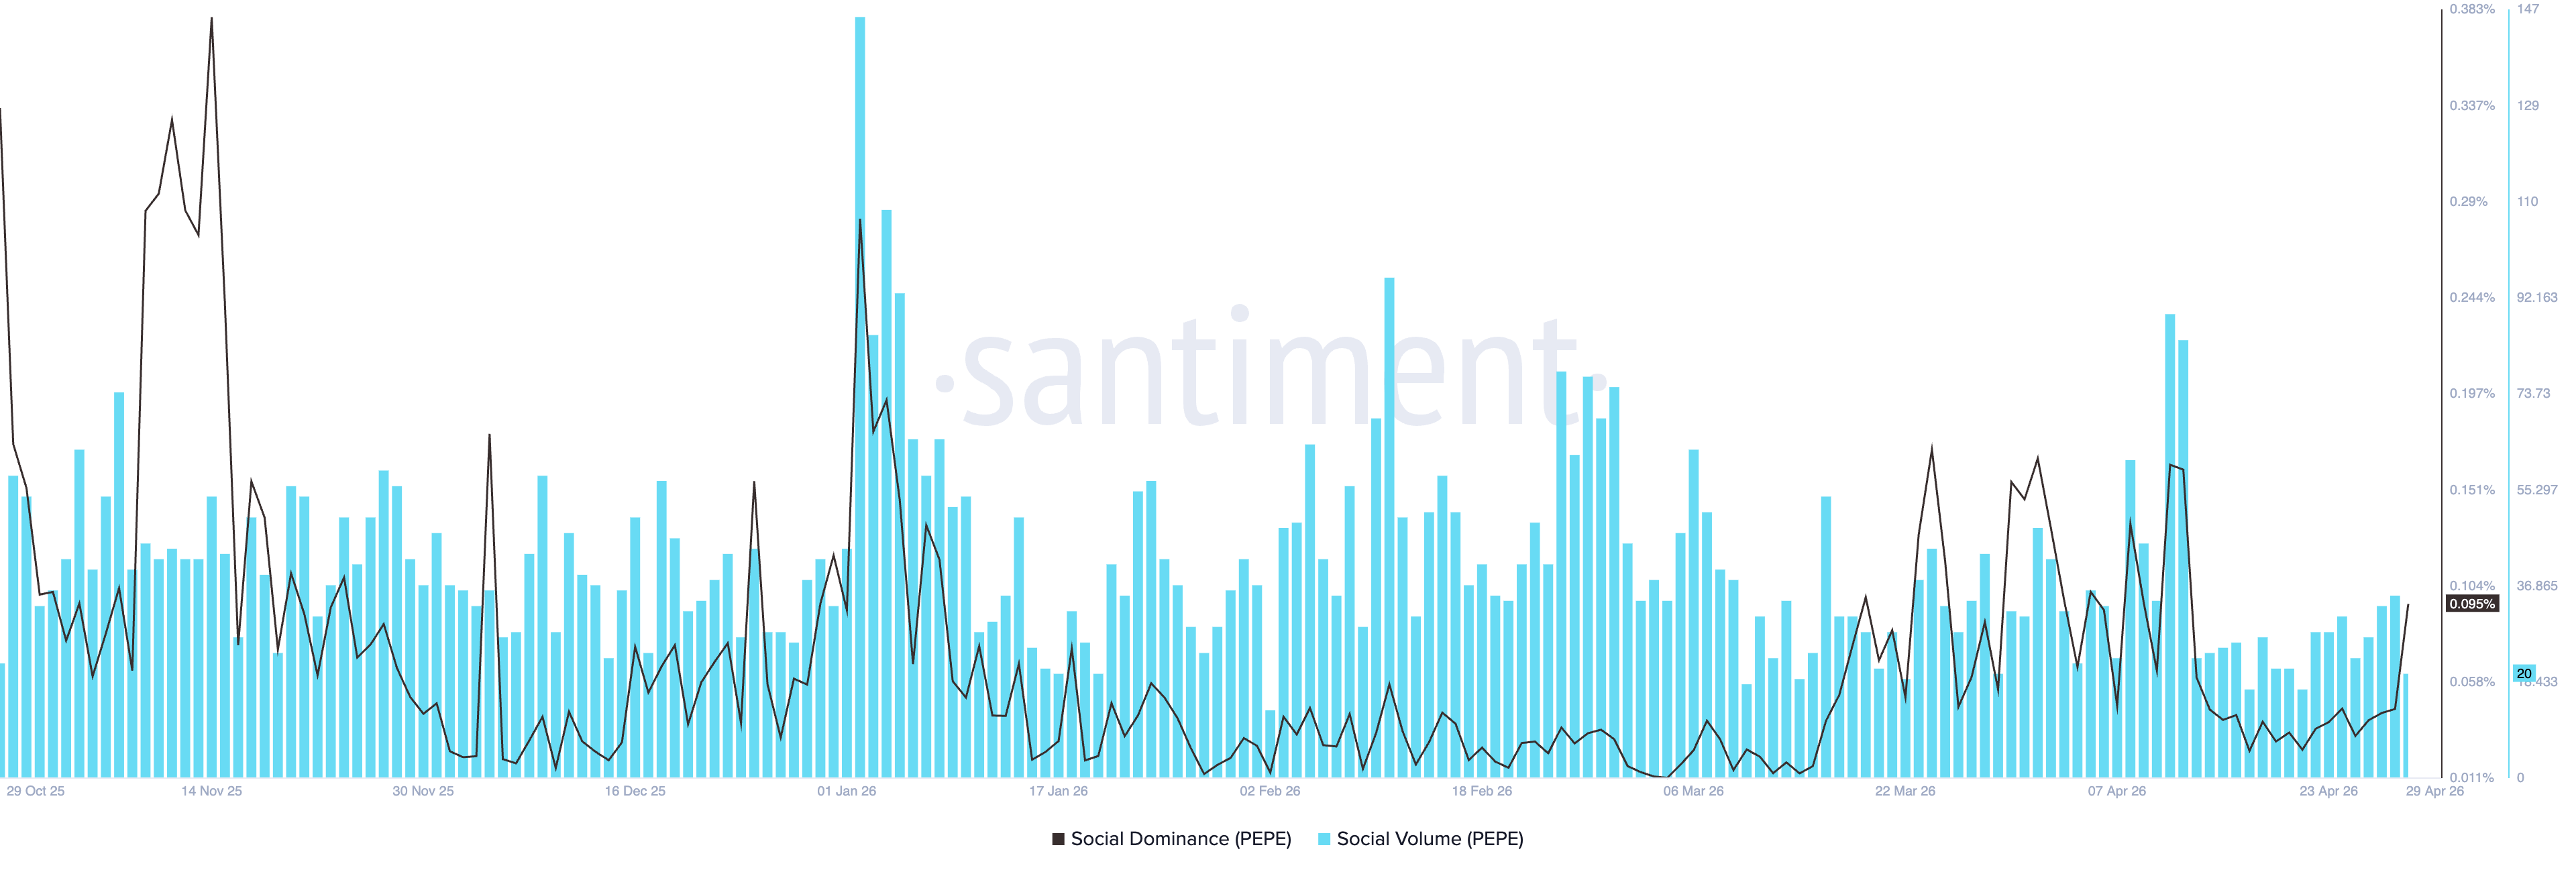
A surge in social interest in Pepe fuels leverage-linked trading activity, reflecting upside anticipation among investors. Santiment data shows social interest in PEPE is rising, with social dominance at 0.095% on Wednesday, up from 0.044% the previous day.
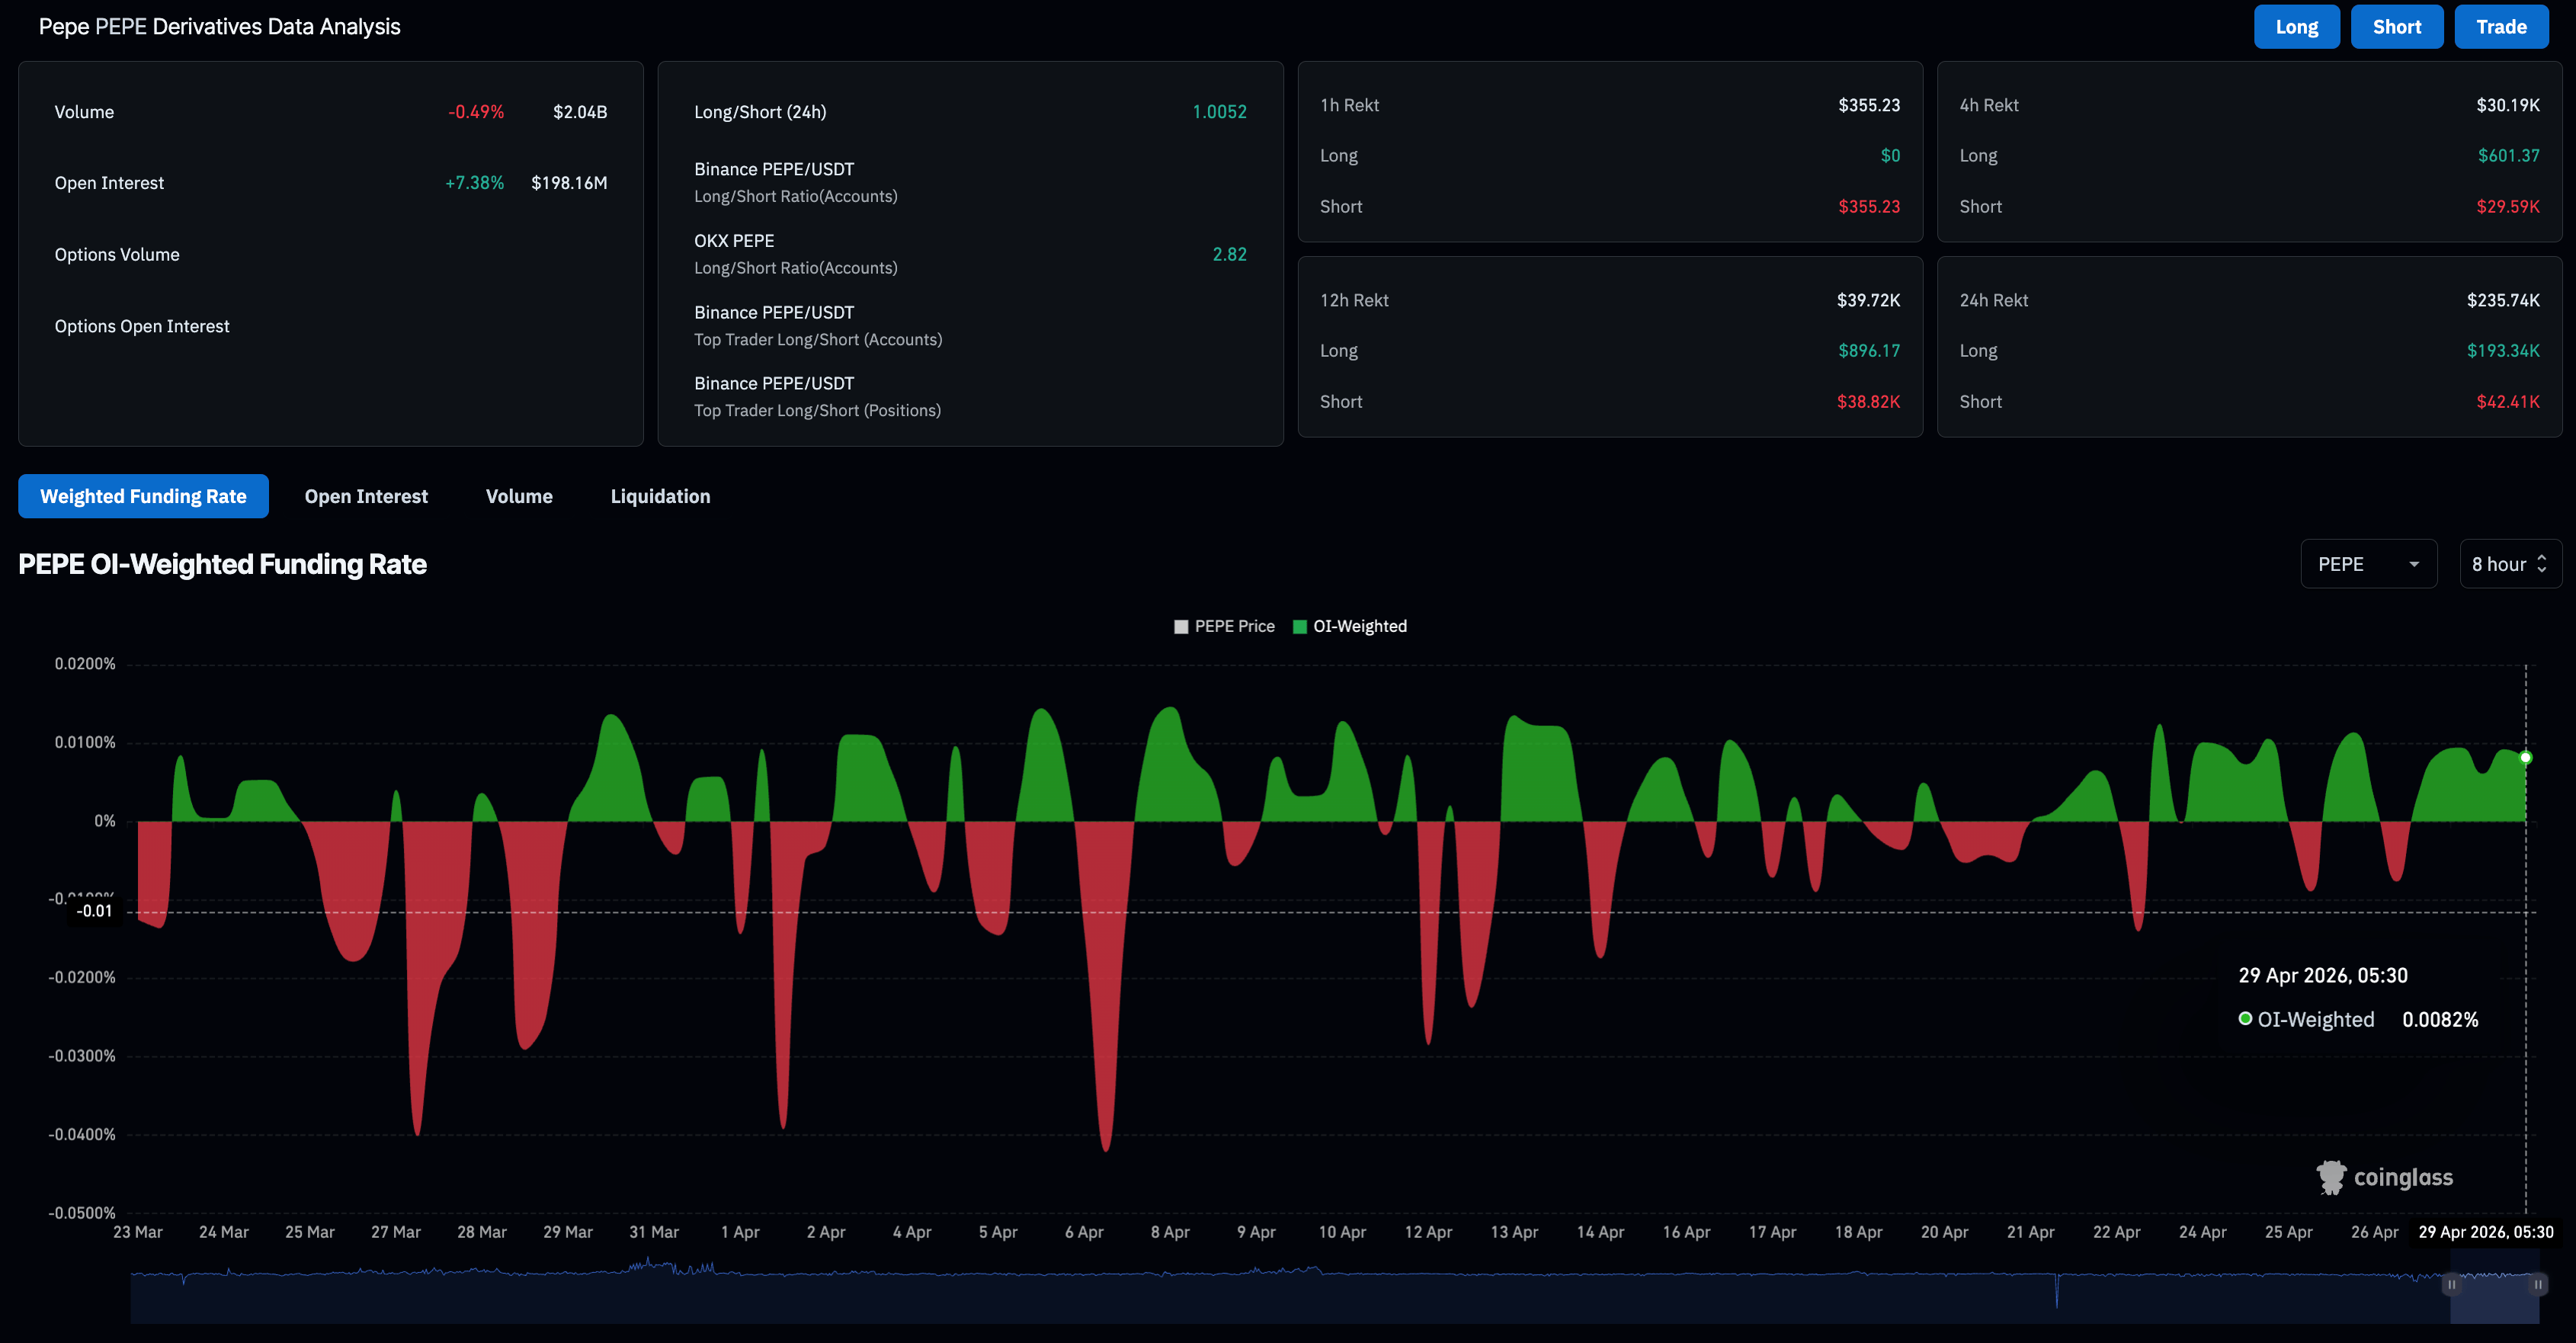
On the other hand, CoinGlass data shows the PEPE futures Open Interest (OI) is up over 7% in the last 24 hours, reaching $198.16 million, indicating an increased notional value of outstanding futures contracts. Meanwhile, the funding rate remains positive at 0.0082%, suggesting that traders' sentiment remains bullish.
Is Pepe ready for a rally?
Pepe extends gains above its short-term 50-day Exponential Moving Averages (EMAs) at $0.00000372 to test the downward resistance trendline near $0.00000400, which previously capped gains. This leaves the near-term bias neutral and mixed.
The Relative Strength Index (RSI) at 58 on the daily chart leans slightly to the bullish side while the Moving Average Convergence Divergence (MACD) holds slightly above its signal line, suggesting that momentum shows modest upside pressure rather than a defined trend.
A decisive close above $0.00000400 would confirm the trendline breakout, opening the path toward the 200-day EMA at $0.00000498.
On the flip side, the 50-day EMA at $0.00000372 stands as the immediate support, guarding a steeper downside to the February 6 low at $0.00000311.
(The technical analysis of this story was written with the help of an AI tool.)
Recommended Articles








Comments (0)
Click the $ button, enter the symbol, and select to link a stock, ETF, or other ticker.