


Luna Classic Price Prediction: LUNC token burn fuels recovery to four-month high



- Luna Classic hovers below $0.000070 on Tuesday, after a 10% rise the previous day.
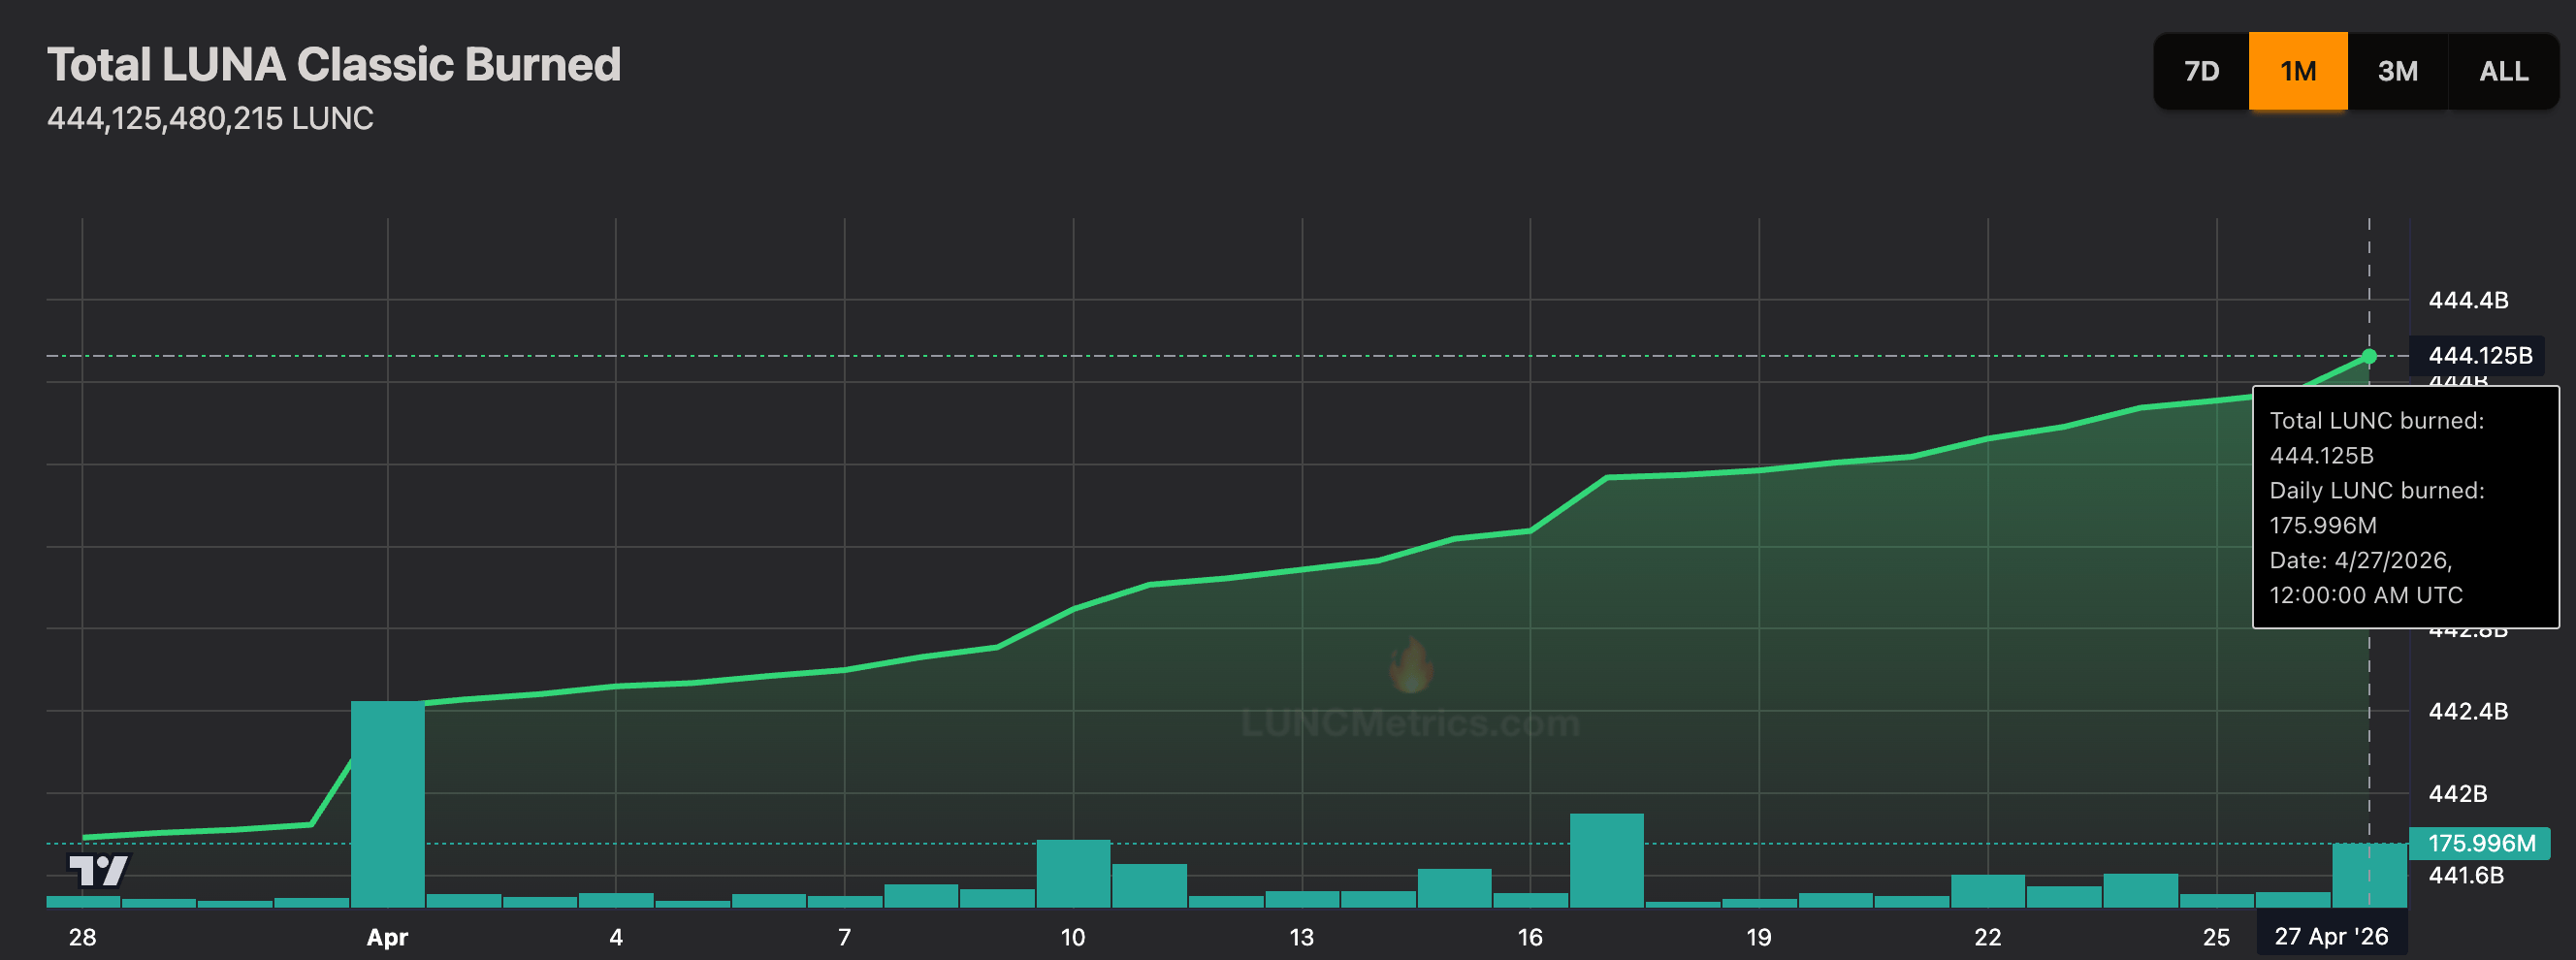
- Roughly 176 million LUNC tokens burned on Monday fuel the near-term recovery.
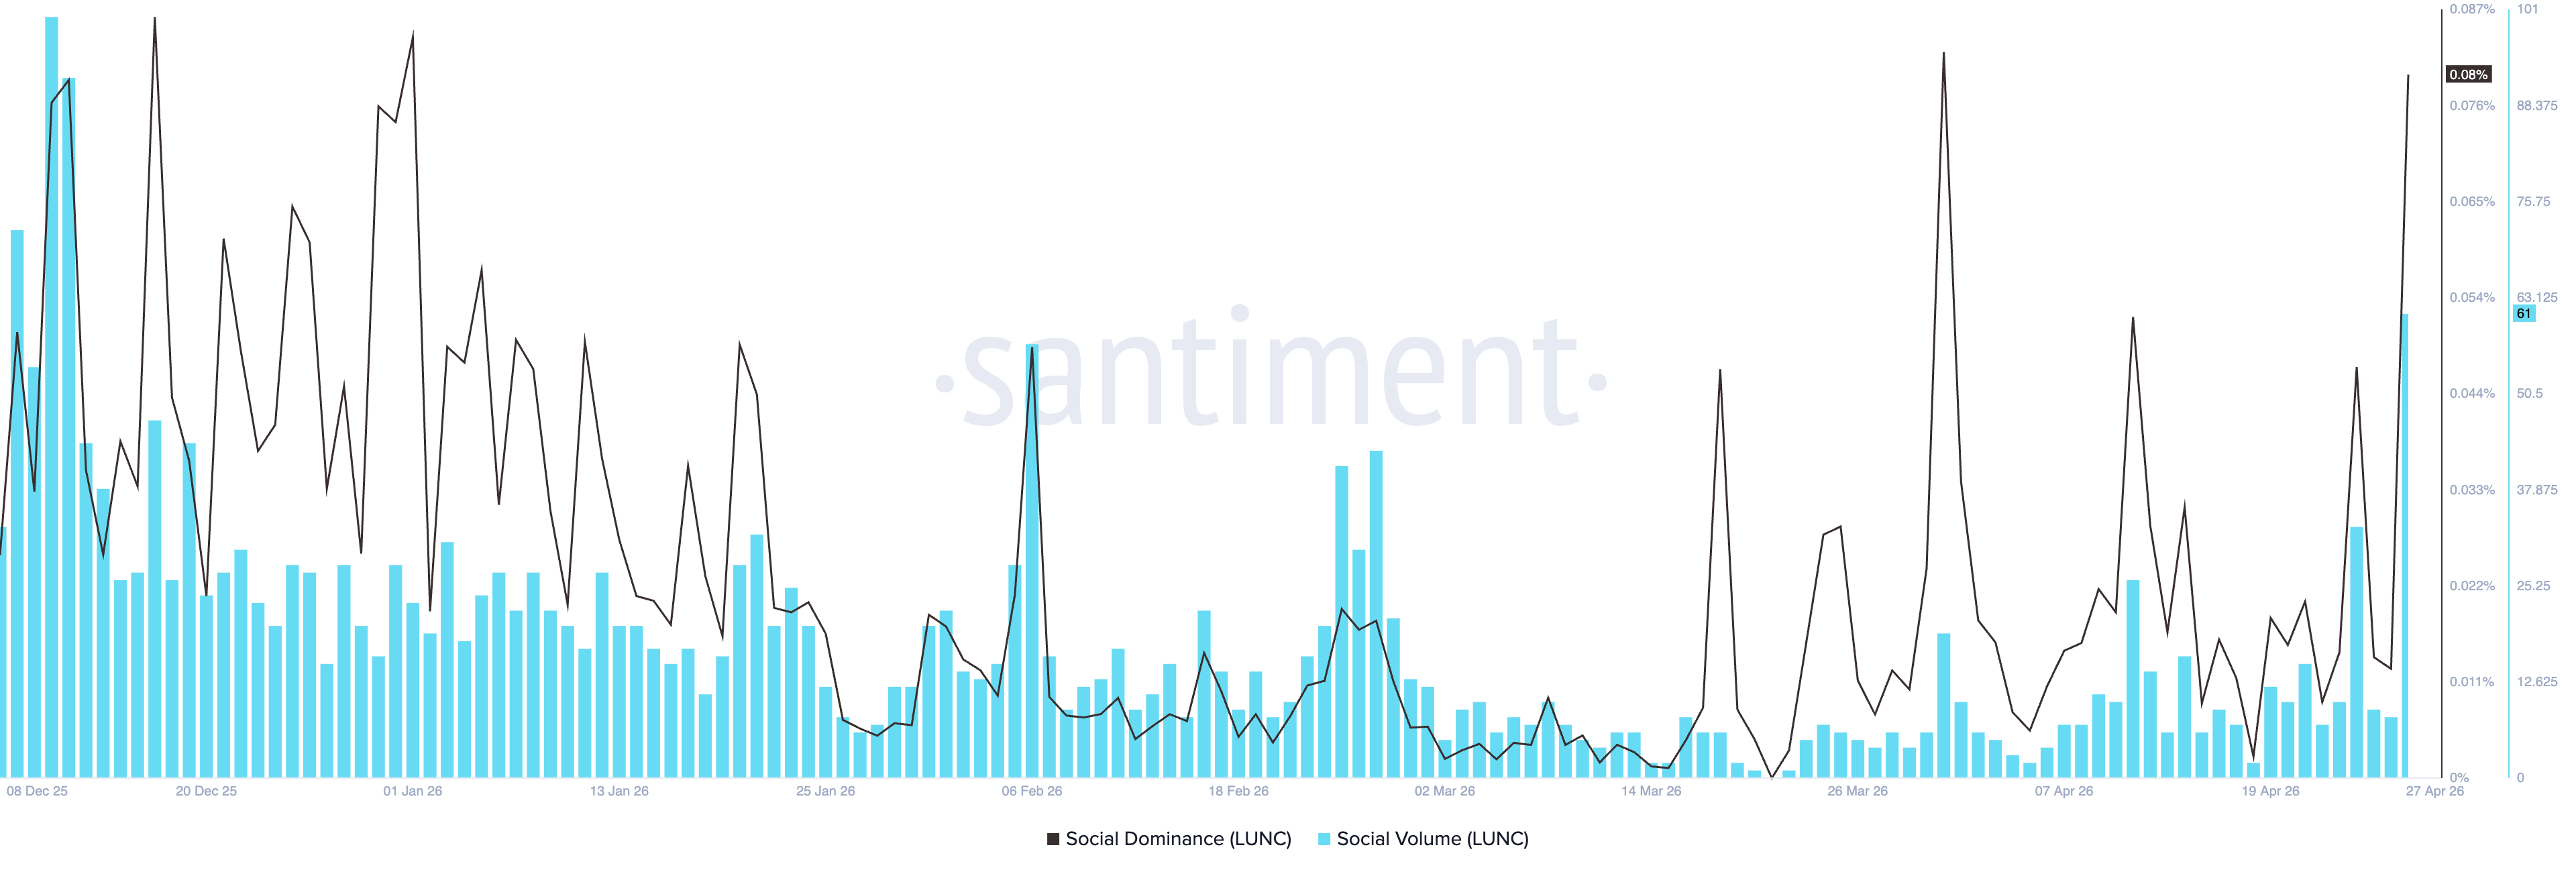
- Luna Classic regains retail attention with a surge in social dominance and volume.
Luna Classic (LUNC) trades below $0.000070 at press time on Tuesday, taking a breather after three consecutive days of gains. The recovery run aligns with a surge in social buzz and the removal of roughly 176 million LUNC from circulation. The technical outlook is cautiously optimistic, with LUNC needing to surpass the $0.000070 barrier for further gains.
Token burn and social interest fuel LUNC recovery
Luna Classic’s reduction in available supply by token burns underpins near-term recovery. Data shows that 175.99 million LUNC tokens were effectively removed from circulation, easing downside pressure.
On the other hand, the Santiment data shows a spike in the social dominance and volume to 0.08% and 61, reflecting renewed retail interest in the LUNC token.
Will Luna Classic extend its rally above $0.000070?
Luna Classic holds above both the 50-day and 200-day Exponential Moving Averages (EMAs) clustered near $0.000044, flashing a Golden Cross pattern. This recovery keeps a constructive short-term bias while price tests the 78.6% Fibonacci retracement level at $0.000070. A daily close above this level could target the December 6 high at $0.000081.
The Relative Strength Index (RSI) sits deep in overbought territory near 78, hinting that upside momentum is stretched even as price consolidates around this key band, while the Moving Average Convergence Divergence (MACD) and signal line rise above the zero line, suggesting limited follow-through so far.
On the downside, initial support is seen at the 61.8% and 50% Fibonacci retracement levels at $0.000062 and $0.000056, respectively.
(The technical analysis of this story was written with the help of an AI tool.)
Recommended Articles








Comments (0)
Click the $ button, enter the symbol, and select to link a stock, ETF, or other ticker.