


Pi Network Price Forecast: Two-day mainnet migration halt underpins bullish outlook



- Pi Network holds steady around $0.1800 on Monday, following a 5% jump on Sunday.
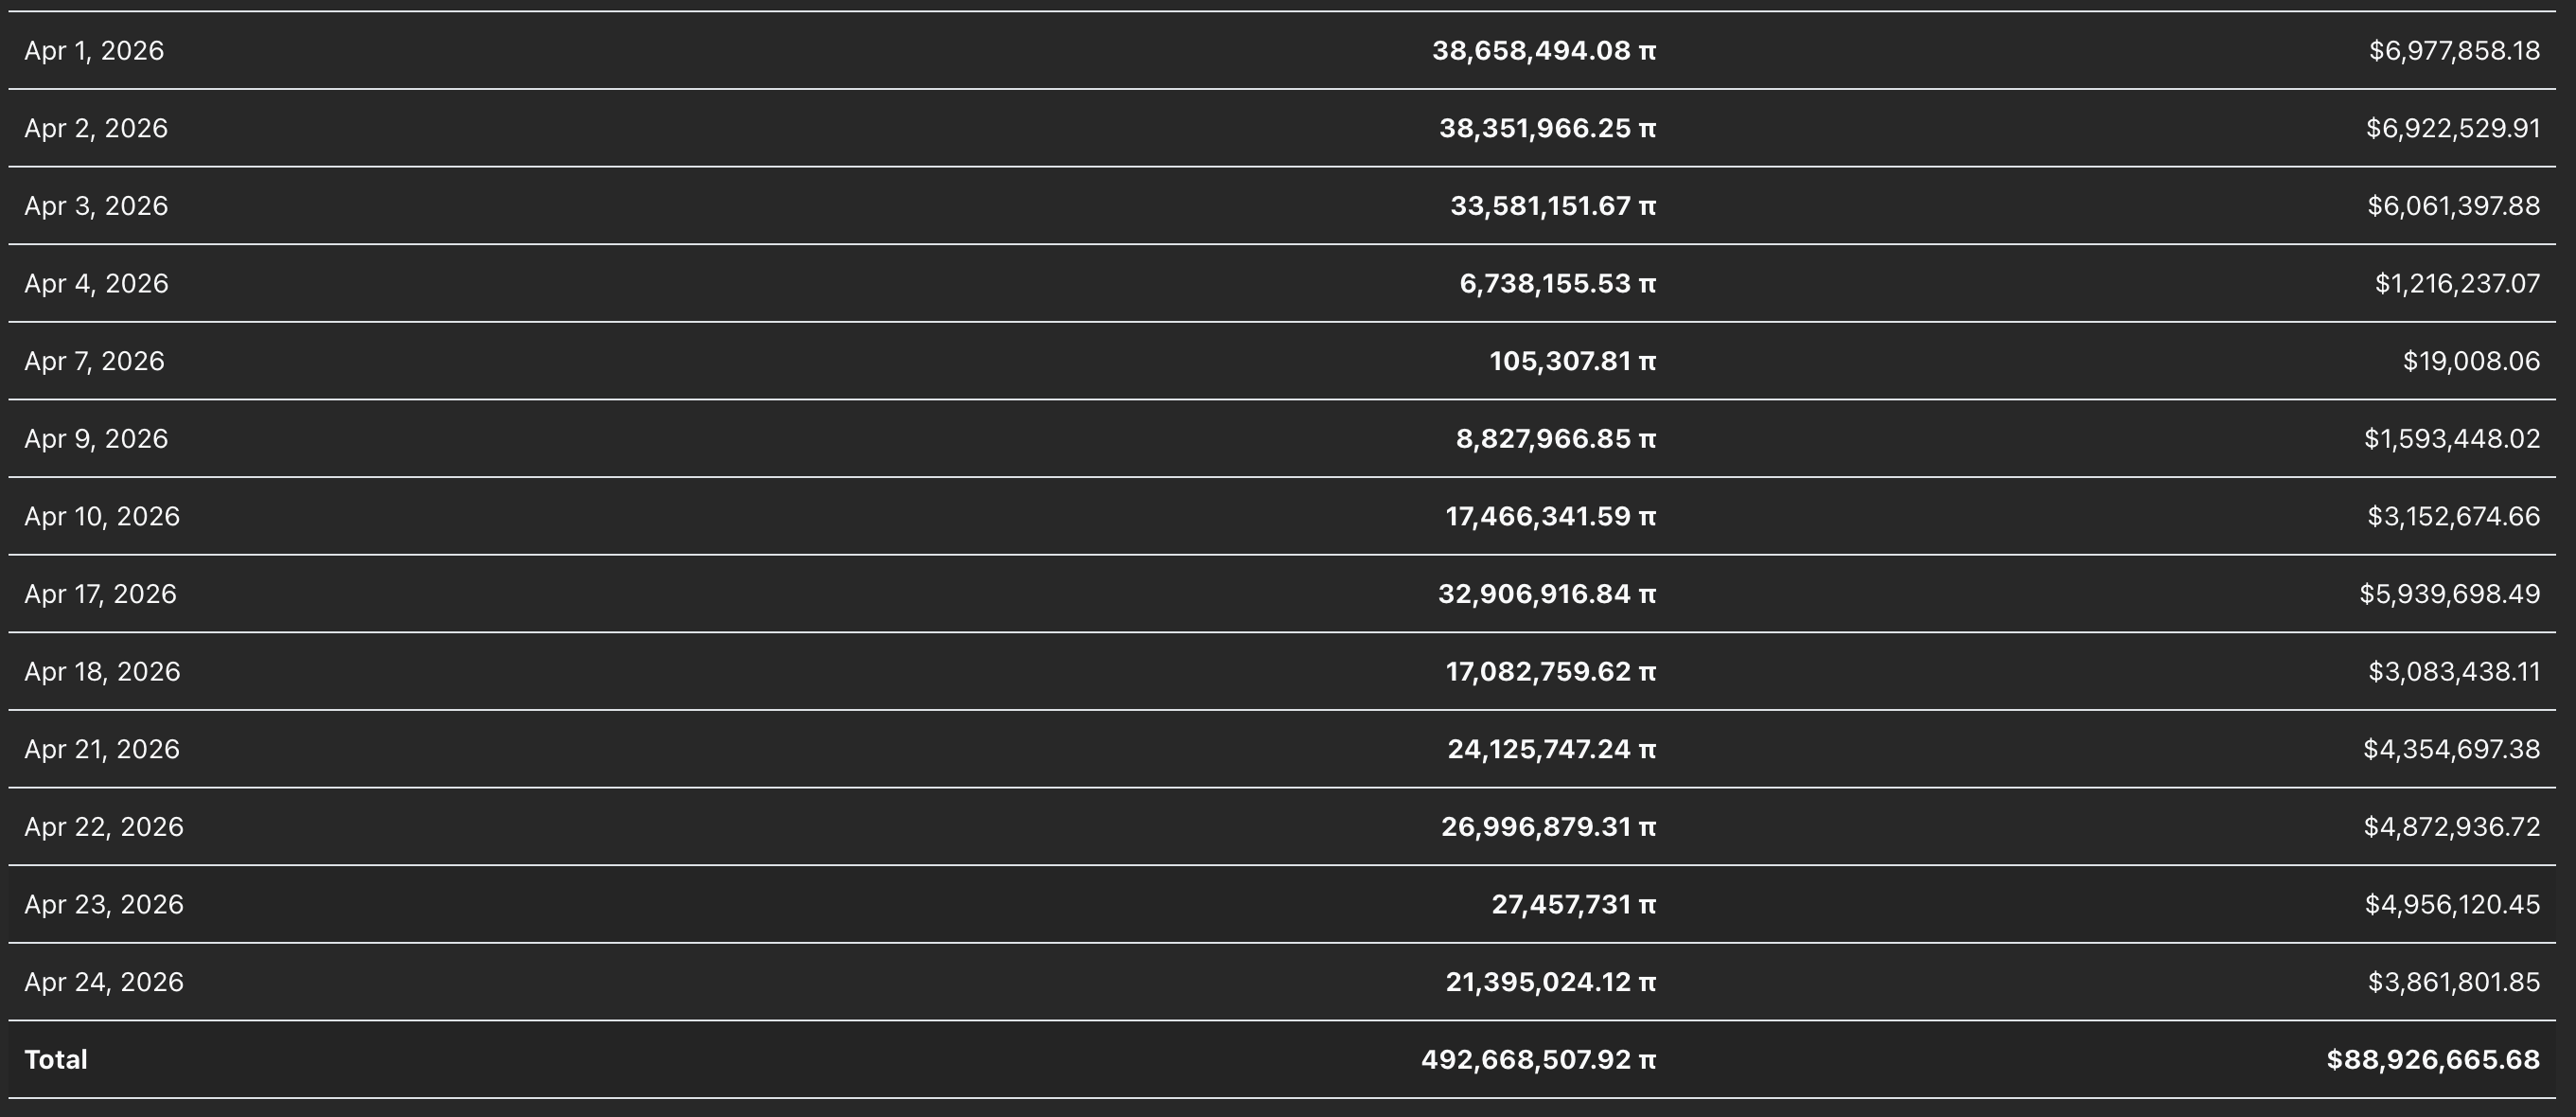
- PiScan data shows a two-day halt in the supply migration to the mainnet reduced downside pressure.
- The technical outlook for the PI token suggests potential upside as bullish pressure builds.
Pi Network (PI) trades near $0.1800 at press time on Monday, holding above its 50-day Exponential Moving Average (EMA) at $0.1768 after Sunday's 5% recovery. The three-day recovery aligned with a two-day pause in mainnet migration, which eased the headwinds. The technical outlook for Pi Network is cautiously bullish, with the price testing a potential down-channel breakout.
PI token rebounds as mainnet migration hits pause
Pi Network has been in a broad decline due to consistent downside pressure from the mainnet token migration, which enables PI token holders, commonly referred to as Pioneers. PiScan data shows a two-day pause in the mainnet migration aligned with Sunday's 5% recovery as the headwinds eased.
Technical outlook: Resistance trendline caps short-term recovery
Pi Network edges lower at press time on Monday as the overhead trendline of a downward channel caps Sunday's recovery. Still, the PI token has pushed back above the 50-day EMA at $0.1768, tilting the near-term tone toward a modestly constructive bias.
The positive Moving Average Convergence Divergence (MACD) histogram widens as the MACD and signal line rise toward the zero line, while the Relative Strength Index (RSI) at 56 rises without signaling overbought conditions, suggesting buyers are gradually regaining control.
On the topside, initial resistance is seen at the downward trendline at $0.1841, where a daily close above it would open the way for a more meaningful recovery toward the $0.2000 psychological level and the 200-day EMA at $0.2446.
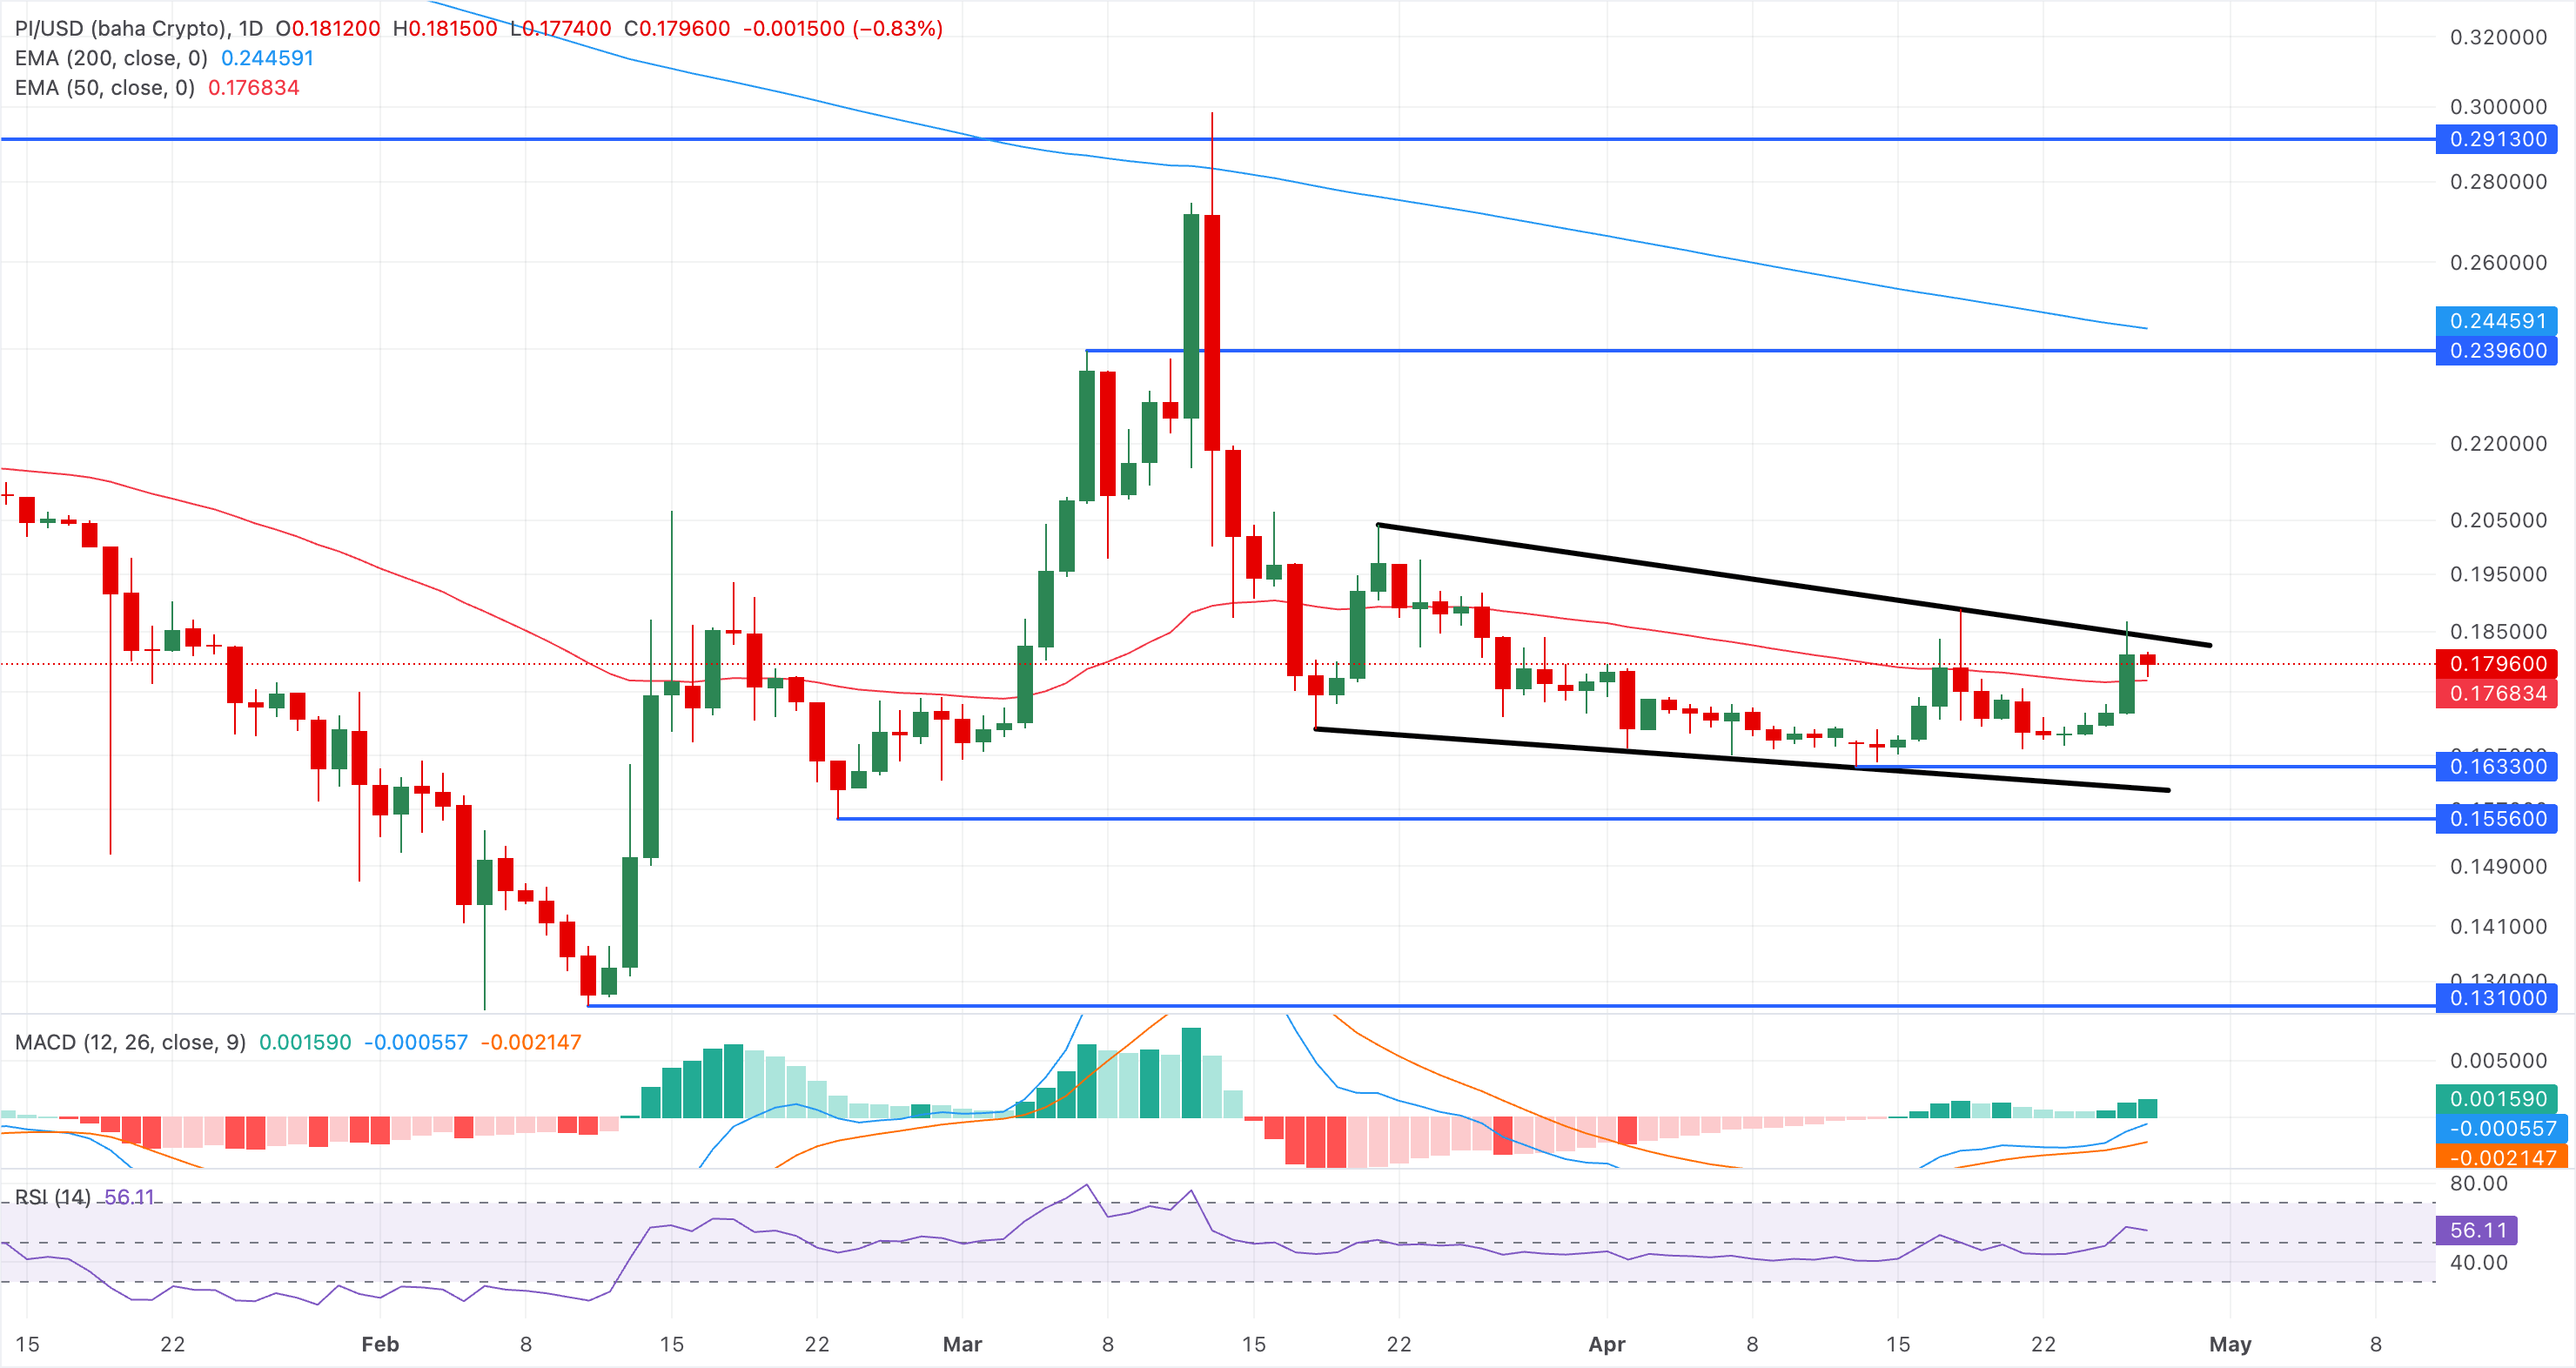
On the downside, the 50-day EMA at $0.1768 offers immediate support; a drop back below this floor would signal fading bullish momentum and expose a deeper pullback within the prevailing longer-term downtrend.
(The technical analysis of this story was written with the help of an AI tool.)
Recommended Articles








Comments (0)
Click the $ button, enter the symbol, and select to link a stock, ETF, or other ticker.