


Bitcoin 20% Price Crash Is Coming As Analyst Points Out Possible Bottom



Bitcoin has spiked to its highest price level in almost three months, reclaiming $79,000 on the back of new institutional appetite. However, technical analysis shows that this rally is not a reason to celebrate, as it created an imperfection. According to technical analyst TARA, an important macro Fibonacci resistance level is now directly overhead, and Bitcoin might see a strong reaction at this level.
Bitcoin Approaching Macro Resistance Around $80,000
Bitcoin climbed past $79,000 on April 22, hitting an 11-week high following President Trump’s extension of the US-Iran ceasefire. This development removed immediate fears over a resumption of conflict near the Strait of Hormuz, and this was enough to lead to inflows into different investment markets.
The latest analysis from crypto analyst TARA is based on Bitcoin’s interaction with the macro 0.382 Fibonacci resistance, positioned between roughly $79,000 and $81,000. BTC has been climbing in a structured sequence, forming higher highs and higher lows into this resistance zone on the daily candlestick price chart. According to the analyst, BTC’s recent rally is a final approach to a wall, one it has hit before and one she believes it will hit again.
Her chart shows Bitcoin completing what appears to be an ABC corrective wave structure, with the price tagging the top of the (C) wave around the 0.382 Fib level. At the time of writing, Bitcoin is trading at $77,655. The projection is that it will reject anywhere between $79,000 and $81,000 before embarking on a large drop to another macro Fib level.
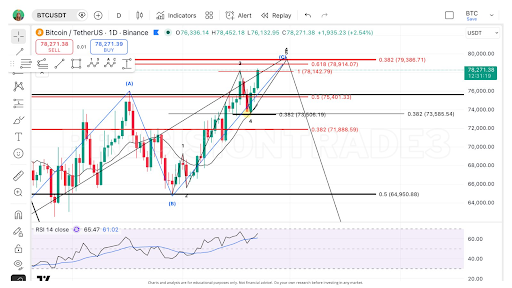
Bitcoin Price Chart. Source: @PrecisionTrade3 On X
Incoming 20% BTC Price Crash
TARA pointed to another technical warning found in a price momentum indicator. The RSI on mid-timeframe charts is already printing bearish divergence, meaning that as price pushes higher, momentum is declining. At the time of the analysis, the indicator was at 65.47 with its signal line at 61.02.
Based on the current setup, TARA expects this divergence to persist into the final push toward resistance. If the RSI continues to flatten or decline while Bitcoin tests the $79,000 to $81,000 range, it would reinforce the idea that the move is running out of momentum. A similar analysis from crypto analyst Michael van de Poppe also acknowledged that the $79,000 level is filled with sell orders that caused the BTC price to fall back lightly.
The downside target is not modest if TARA’s analysis is correct, as the prediction is that Bitcoin will return to at least the macro 0.5 Fibonacci retracement, which is currently situated around $64,500. That would indicate a drop from the resistance zone of roughly 18% to 20%. If the larger corrective structure is fully implemented, then Bitcoin might undergo a full downward move into support levels around $52,000.
Recommended Articles








Comments (0)
Click the $ button, enter the symbol, and select to link a stock, ETF, or other ticker.