


Altcoins Have Recovered $90B Since February – Analyst Explains Market Dynamics



Altcoins have been one of crypto’s most painful stories of the past few years. The 2022 bear market broke valuations across the sector, and the recovery that followed never fully delivered on its promise. The altseason that traders had been anticipating through 2024 and into 2025 arrived in fragmented, selective bursts rather than the broad-based surge the cycle was supposed to produce. For holders of most altcoins, the wait has been long — and expensive.
The most recent chapter made things worse before they got better. According to analyst Darkfost, the October 2025 cycle top triggered another significant leg down for the altcoin sector. Total 3 — the combined market capitalization of altcoins excluding Bitcoin, Ethereum, and stablecoins — lost nearly $460 billion from that peak, a decline of roughly 38%. That is not a routine pullback. It is a wipeout that, for many tokens, extended losses that had never been recovered from 2022 in the first place.
Since February, however, the picture has started shifting. Total 3 has recovered approximately $90 billion — a meaningful rebound accomplished against a backdrop of ongoing geopolitical tension and a macroeconomic environment that continues to restrict the liquidity flows that altcoins depend on to move.
The recovery is real. Whether it is the beginning of something larger or another false start is the question the data is now building toward.
The Numbers Are Improving, But The Landscape Has Never Been More Crowded
The technical picture adds a layer of context to the $90 billion recovery. Darkfost points to the percentage of altcoins on Binance trading below their weekly 50-period moving average — a level that functions as a meaningful dividing line between assets in technical distress and those beginning to show genuine strength. In early February, 89% of altcoins on Binance sat below that threshold. Today, that figure has dropped to 67%.

The direction is encouraging. A 22-percentage-point improvement in the share of altcoins recovering above a key technical level reflects something real happening beneath the surface — not a broad market explosion, but a gradual return of selective interest after a period of widespread capitulation.
The caution, however, is structural and significant. Liquidity conditions remain constrained, which means the capital available to drive altcoin recoveries is not abundant. And the number of assets competing for that limited capital has reached a scale that is difficult to fully absorb. There are now approximately 49 million cryptocurrencies in existence — more than 22 million on Solana alone, 19 million on Base, and nearly 5 million on BNB Smart Chain.
That number reframes the recovery entirely. When $90 billion must be spread across 49 million assets, the average token receives almost nothing. The improvement in the moving average data is real, but it is concentrated. In a market this fragmented, the difference between the tokens that recover and the ones that do not will come down to selection — and the margin for error has never been smaller.
Altcoins Attempt Recovery Within a Fragile Structure
The total crypto market cap, excluding the top 10 assets, is attempting to stabilize near the $180 billion level after a prolonged period of weakness that followed the 2025 peak. The broader structure remains mixed. While the sharp decline from the $300B–$320B region has slowed, price has not yet established a convincing uptrend.
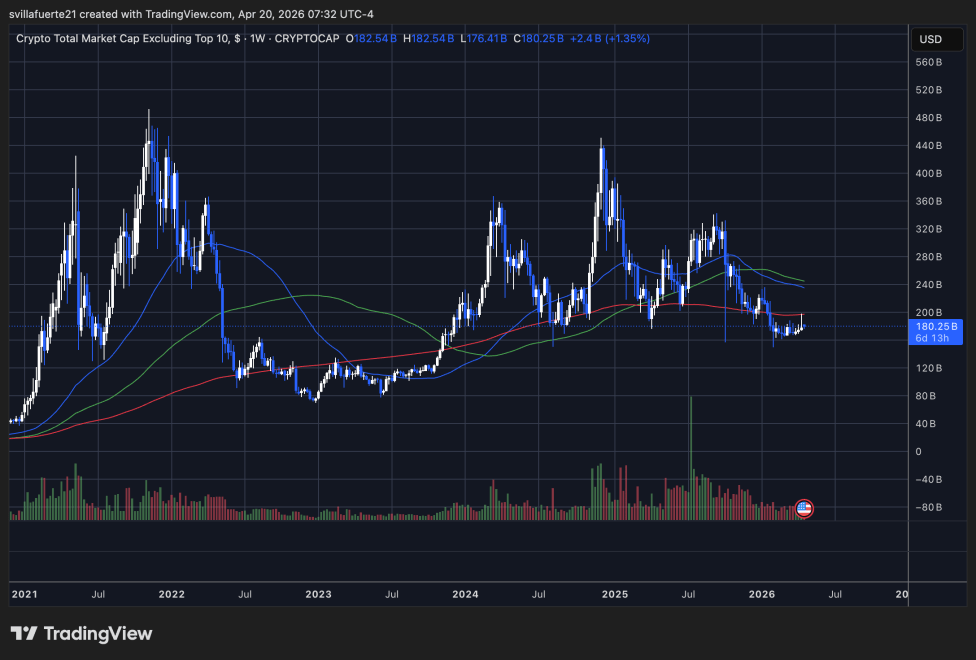
From a structural perspective, the market is still operating below the 200-week moving average, which continues to slope downward and act as a macro resistance level. This is a critical detail. Historically, sustained altcoin expansions tend to occur only after reclaiming and holding above this level, which has not yet happened.
The recent bounce from the sub-$150B region shows early signs of demand returning, but the recovery remains modest relative to the prior drawdown. The current range between roughly $170B and $220B reflects a consolidation phase rather than a confirmed reversal.
Volume trends reinforce the cautious outlook. While there was a notable spike during the sell-off phase, recent activity has declined, indicating reduced participation and limited conviction behind the rebound.
For a more constructive outlook, the market would need to break above the $220B–$240B zone and sustain momentum. Until then, the current recovery appears fragile, with the structure still vulnerable to renewed downside pressure.
Featured image from ChatGPT, chart from TradingView.com
Recommended Articles








Comments (0)
Click the $ button, enter the symbol, and select to link a stock, ETF, or other ticker.