


Analyst Exposes Bitcoin Market Maker Buy Strategy, Shows What Happens When Accumulation Ends



A crypto analyst has outlined a detailed market structure, suggesting that Bitcoin (BTC) may be entering a decisive stage after months of consolidation and price declines. His strategy maps recent price behavior into a sequence of institutionally driven phases, arguing that the end of accumulation often signals the start of a stronger upward expansion.
The Bitcoin MarketMaker Buy Strategy
Crypto market expert Merlijn The Trader has presented a market structure model on X, showing that Bitcoin’s recent price action is unfolding in line with an institutional trading cycle. The chart framework, known as the MarketMaker Buy Model, argues that large institutional players move markets in predictable stages designed to transfer Bitcoin from emotional retail traders into stronger, long-term holders before pushing prices significantly higher.
According to the analyst, the first stage of the cycle, highlighted in the first green box on the chart, began with a “Distribution” phase that occurred between about $100,000 and $120,000 in mid-2024. During this period, Bitcoin traded in a choppy downward pattern. This type of movement indicated that large holders were selling their Bitcoin amid strong demand from retail traders buying aggressively near the market top.
The second stage identified by Merlijn The Trader is the “Flush,” marked by the red box on the chart. This phase saw a sharp and aggressive price decline designed to force weaker traders out of the market. Here, Bitcoin reportedly fell from $100,000 to $62,000, a roughly 38% drop.
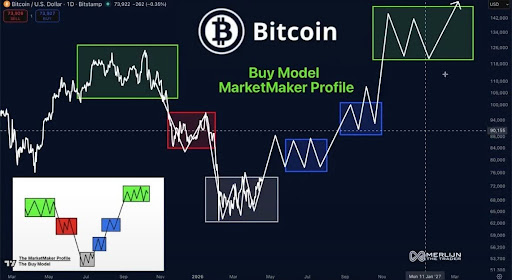
Following this correction, the MarketMaker model transitions into the “Accumulation” phase, represented by the larger grey box on the chart. According to the model, this is the stage where the market is currently consolidating. Merlijn The Trader places this phase between roughly $60,000 and $77,000.
Within this zone, Bitcoin is trading in a relatively tight and choppy range rather than trending strongly in one direction. The sideways movement during this period also suggests that Bitcoin is building a foundation near a potential price bottom, as institutional buyers gradually accumulate more coins.
In the fourth stage, Merlijn The Trader identifies the two blue boxes on the chart as a “Re-accumulation.” This zone, between approximately $80,000 and $95,000, marks a secondary consolidation period that typically follows a price bottom. This phase provides another opportunity for large investors to strengthen their positions before BTC potentially begins its next upward movement.
What’s Next For BTC After Accumulation
Looking ahead, Merlijn The Trader projects a potential upside target above $142,000 once Bitcoin emerges from its accumulation and re-accumulation phases. In his chart model, the path to this level may involve another short consolidation period before a possible breakout into new all-time highs by January 2027.
The analyst also highlights a key resistance level around $70,000. Holding above this resistance is critical to maintaining the integrity of the MarketMaker model. Meanwhile, falling below the level suggests the structure may not be following the expected path.
Recommended Articles








Comments (0)
Click the $ button, enter the symbol, and select to link a stock, ETF, or other ticker.