


Zcash price extends correction as derivatives turn bearish and profit‑taking weighs



- Zcash price extends its correction, trading below $335 on Friday after losing over 8% so far this week.
- Derivatives data support a bearish outlook, with declining retail interest and rising short positions among traders.
- Traders should remain cautious, as the risk of an extended pullback persists following last week’s 47% rally, with profit-taking likely underway.
Zcash (ZEC) is extending its pullback, trading below $335 on Friday after losing over 8% so far this week. Weakening derivatives metrics support a bearish bias for the privacy-focused coin. Traders should remain cautious as correction risks persist after last week’s sharp rally, with rising profit-taking potentially triggering a short-term sell-off.
Derivatives data show a bearish bias
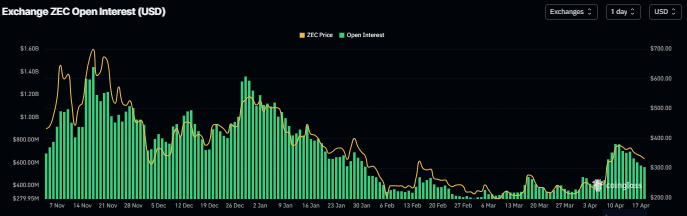
Zcash’s Open Interest (OI) has been continuously declining over the past week, dropping to $560.82 million on Friday from $763.86 million on April 10. This steadily decreasing OI amid a falling price suggests long positions are exiting the market (after a massive price rally last week), indicating a short-term bearish bias and weakening trader participation.
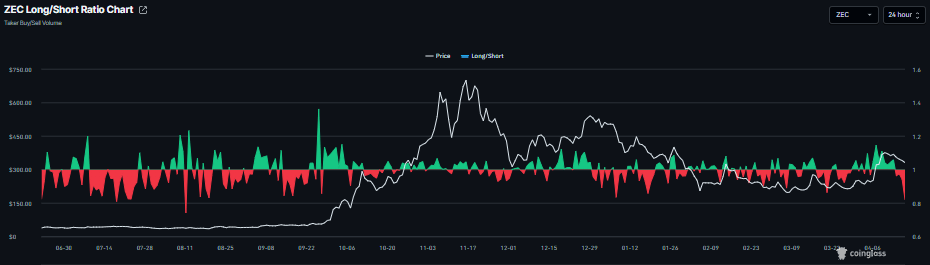
In addition, ZEC’s long-to-short ratio suggests a short-term bearish bias, currently standing at 0.82 on Friday, at levels not seen since January. The ratio below one indicates a bearish sentiment as more traders are betting on the ZEC price to fall.
Zcash Price Forecast: ZEC faces a correction
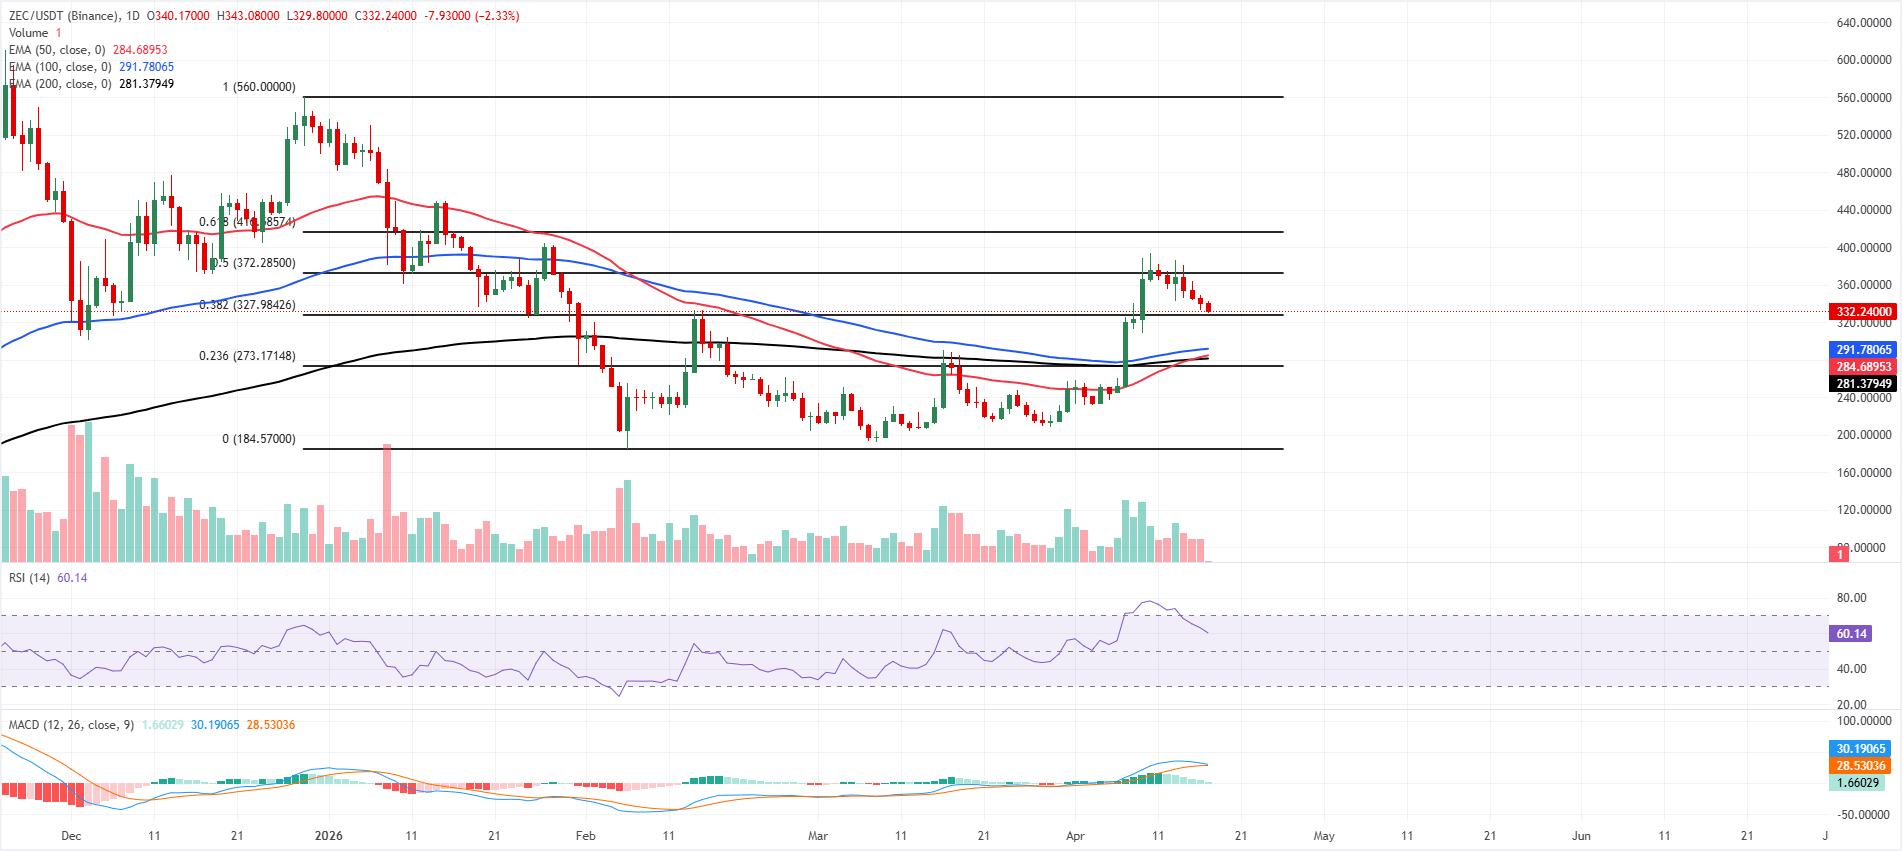
Zcash price extends its correction, trading below $333 on Friday, losing over 8% so far this week. The price action suggests ZEC is holding a constructive bullish bias as price extends above the 50-day, 100-day, and 200-day Exponential Moving Averages (EMAs), which are clustered between roughly $281 and $292. However, the massive rally last week suggests traders may be profit-taking, which could fuel a short-term price pullback.
The Fibonacci 38.2% Fibonacci retracement from the December 19 high to the February 6 low, at $327.98, now acts as immediate underlying support, while a still-elevated Relative Strength Index (RSI) in the daily chart near 60 and a positive but fading Moving Average Convergence Divergence (MACD) histogram hint that upside momentum is moderating rather than reversing.
On the downside, initial support is seen at the $327.98 Fibonacci 38.2% retracement, with the 100-day EMA at $291.78, the 50-day EMA at $284.69 and the 200-day EMA at $281.38 reinforcing a broader demand band ahead of deeper Fibonacci support at $273.17 and the cycle low around $184.57.
On the topside, the next resistance is at $372.29, the 50% retracement, followed by the 61.8% Fibonacci retracement at $416.59, the 78.6% Fibonacci retracement at $479.66, and the $500 psychological level, where profit-taking could intensify if the current advance extends.
(The technical analysis of this story was written with the help of an AI tool.)
Recommended Articles








Comments (0)
Click the $ button, enter the symbol, and select to link a stock, ETF, or other ticker.