


Pi Network Price Forecast: PI recovers as Core Team pushes for mainnet upgrade



- Pi Network holds steady above $0.1700 on Friday after a 3% surge the previous day.
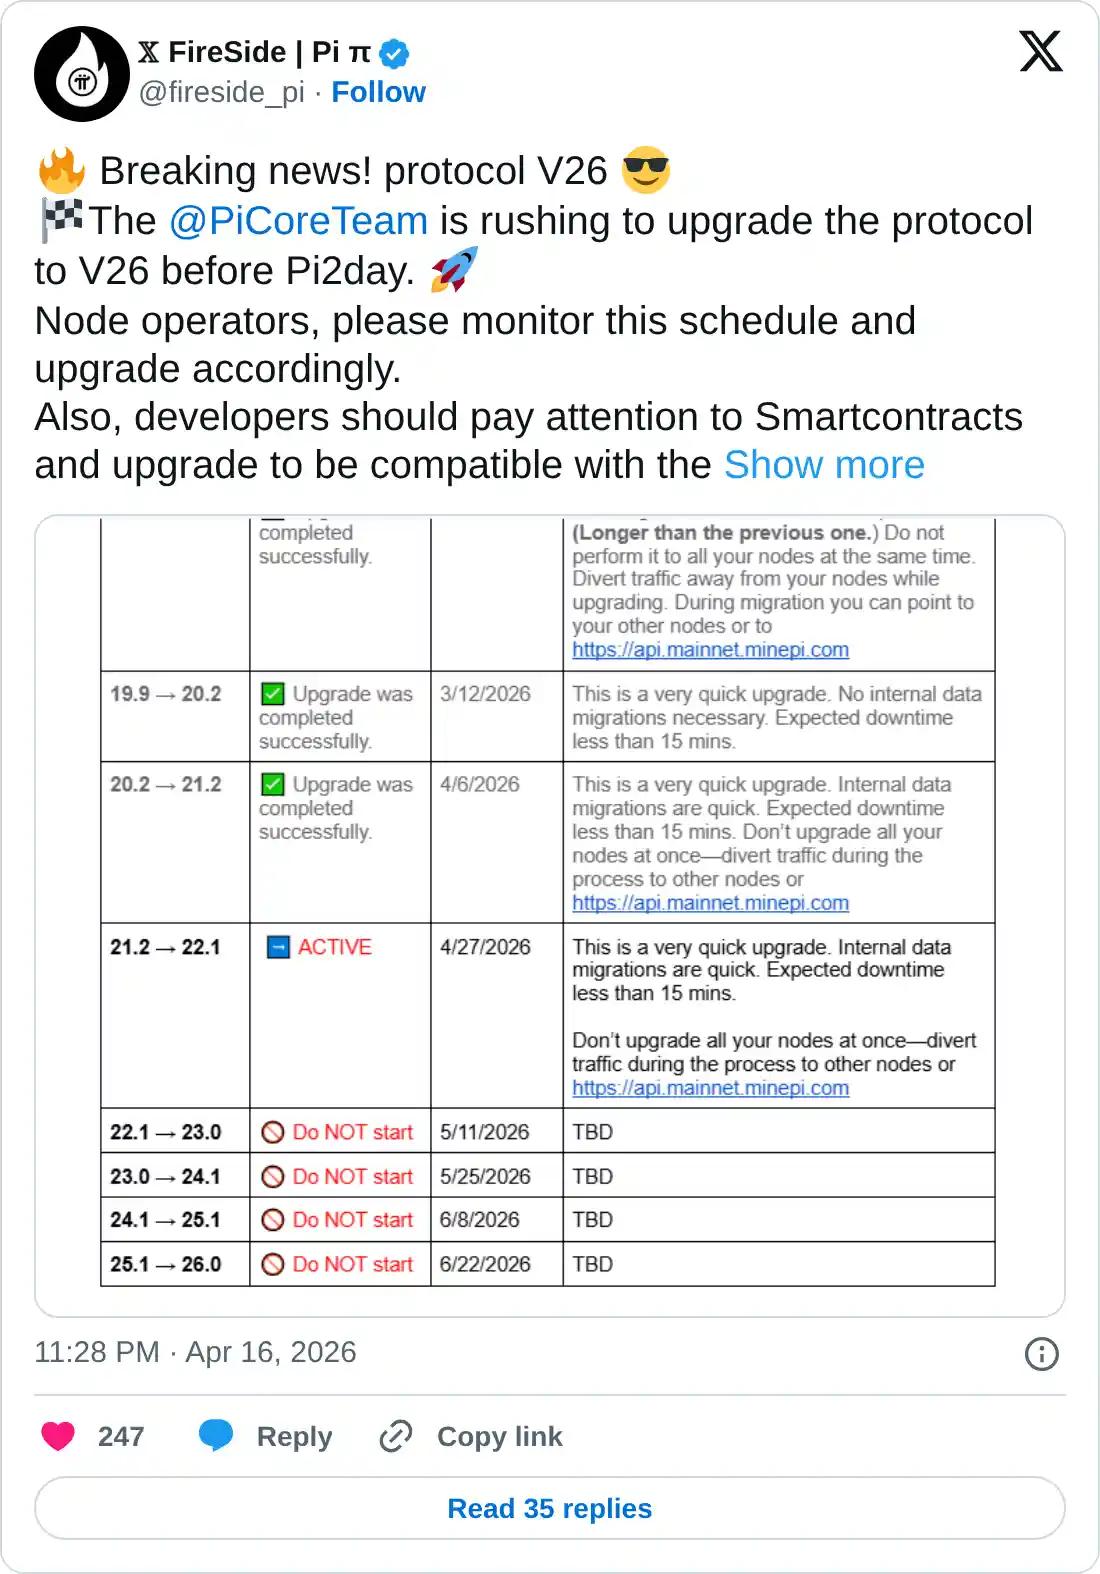
- Pi Core Team plans to upgrade the mainnet to version 26 by June 22, with the immediate deadline of April 27 for version 22.
- PI token must surpass the 100-day EMA at $0.1865 for a steady recovery.
Pi Network (PI) holds steady around $0.1730 at press time on Friday, securing its 3% gains from the previous day. The push from the Pi Core Team (PCT) to upgrade the mainnet to enable smart contract functionality is a near-term catalyst. Technically, the PI token extends its recovery above the 100-day Exponential Moving Average (EMA) at $0.1865 for a positive trend reversal.
Pi Core Team releases the deadline for protocol 22
The Pi Core Team announced April 27 as the final date for all the mainnet nodes to complete the required steps to remain connected to the network amid the Stellar Protocol version 22 upgrade. This upgrade is expected to result in a 15-minute downtime during the internal data transfer.

On the other hand, the timeline reveals the complete upgrade to version 26 is scheduled for June 22, ahead of Pi2Day (June 28).
Will Pi Network recovery evolve into a bull run?
PI token trades around $0.1730 at press time on Friday, up from the $0.1706 low earlier in the day. Pi Network maintains a broadly bearish configuration as it remains below the 50-, 100-, and 200-day Exponential Moving Averages (EMAs).
The 50-day EMA at $0.1785 is the first cap overhead, with the 100-day EMA at $0.1865 reinforcing a congested supply band, while the 200-day EMA near $0.2334 underscores the depth of the broader downtrend.
Momentum conditions are mixed as the Relative Strength Index (RSI) at 48 hovers just below the neutral 50 line on the daily chart. Meanwhile, the Moving Average Convergence Divergence (MACD) has crossed above its signal line, hinting that downside pressure is easing but not yet reversing the dominant bearish bias.
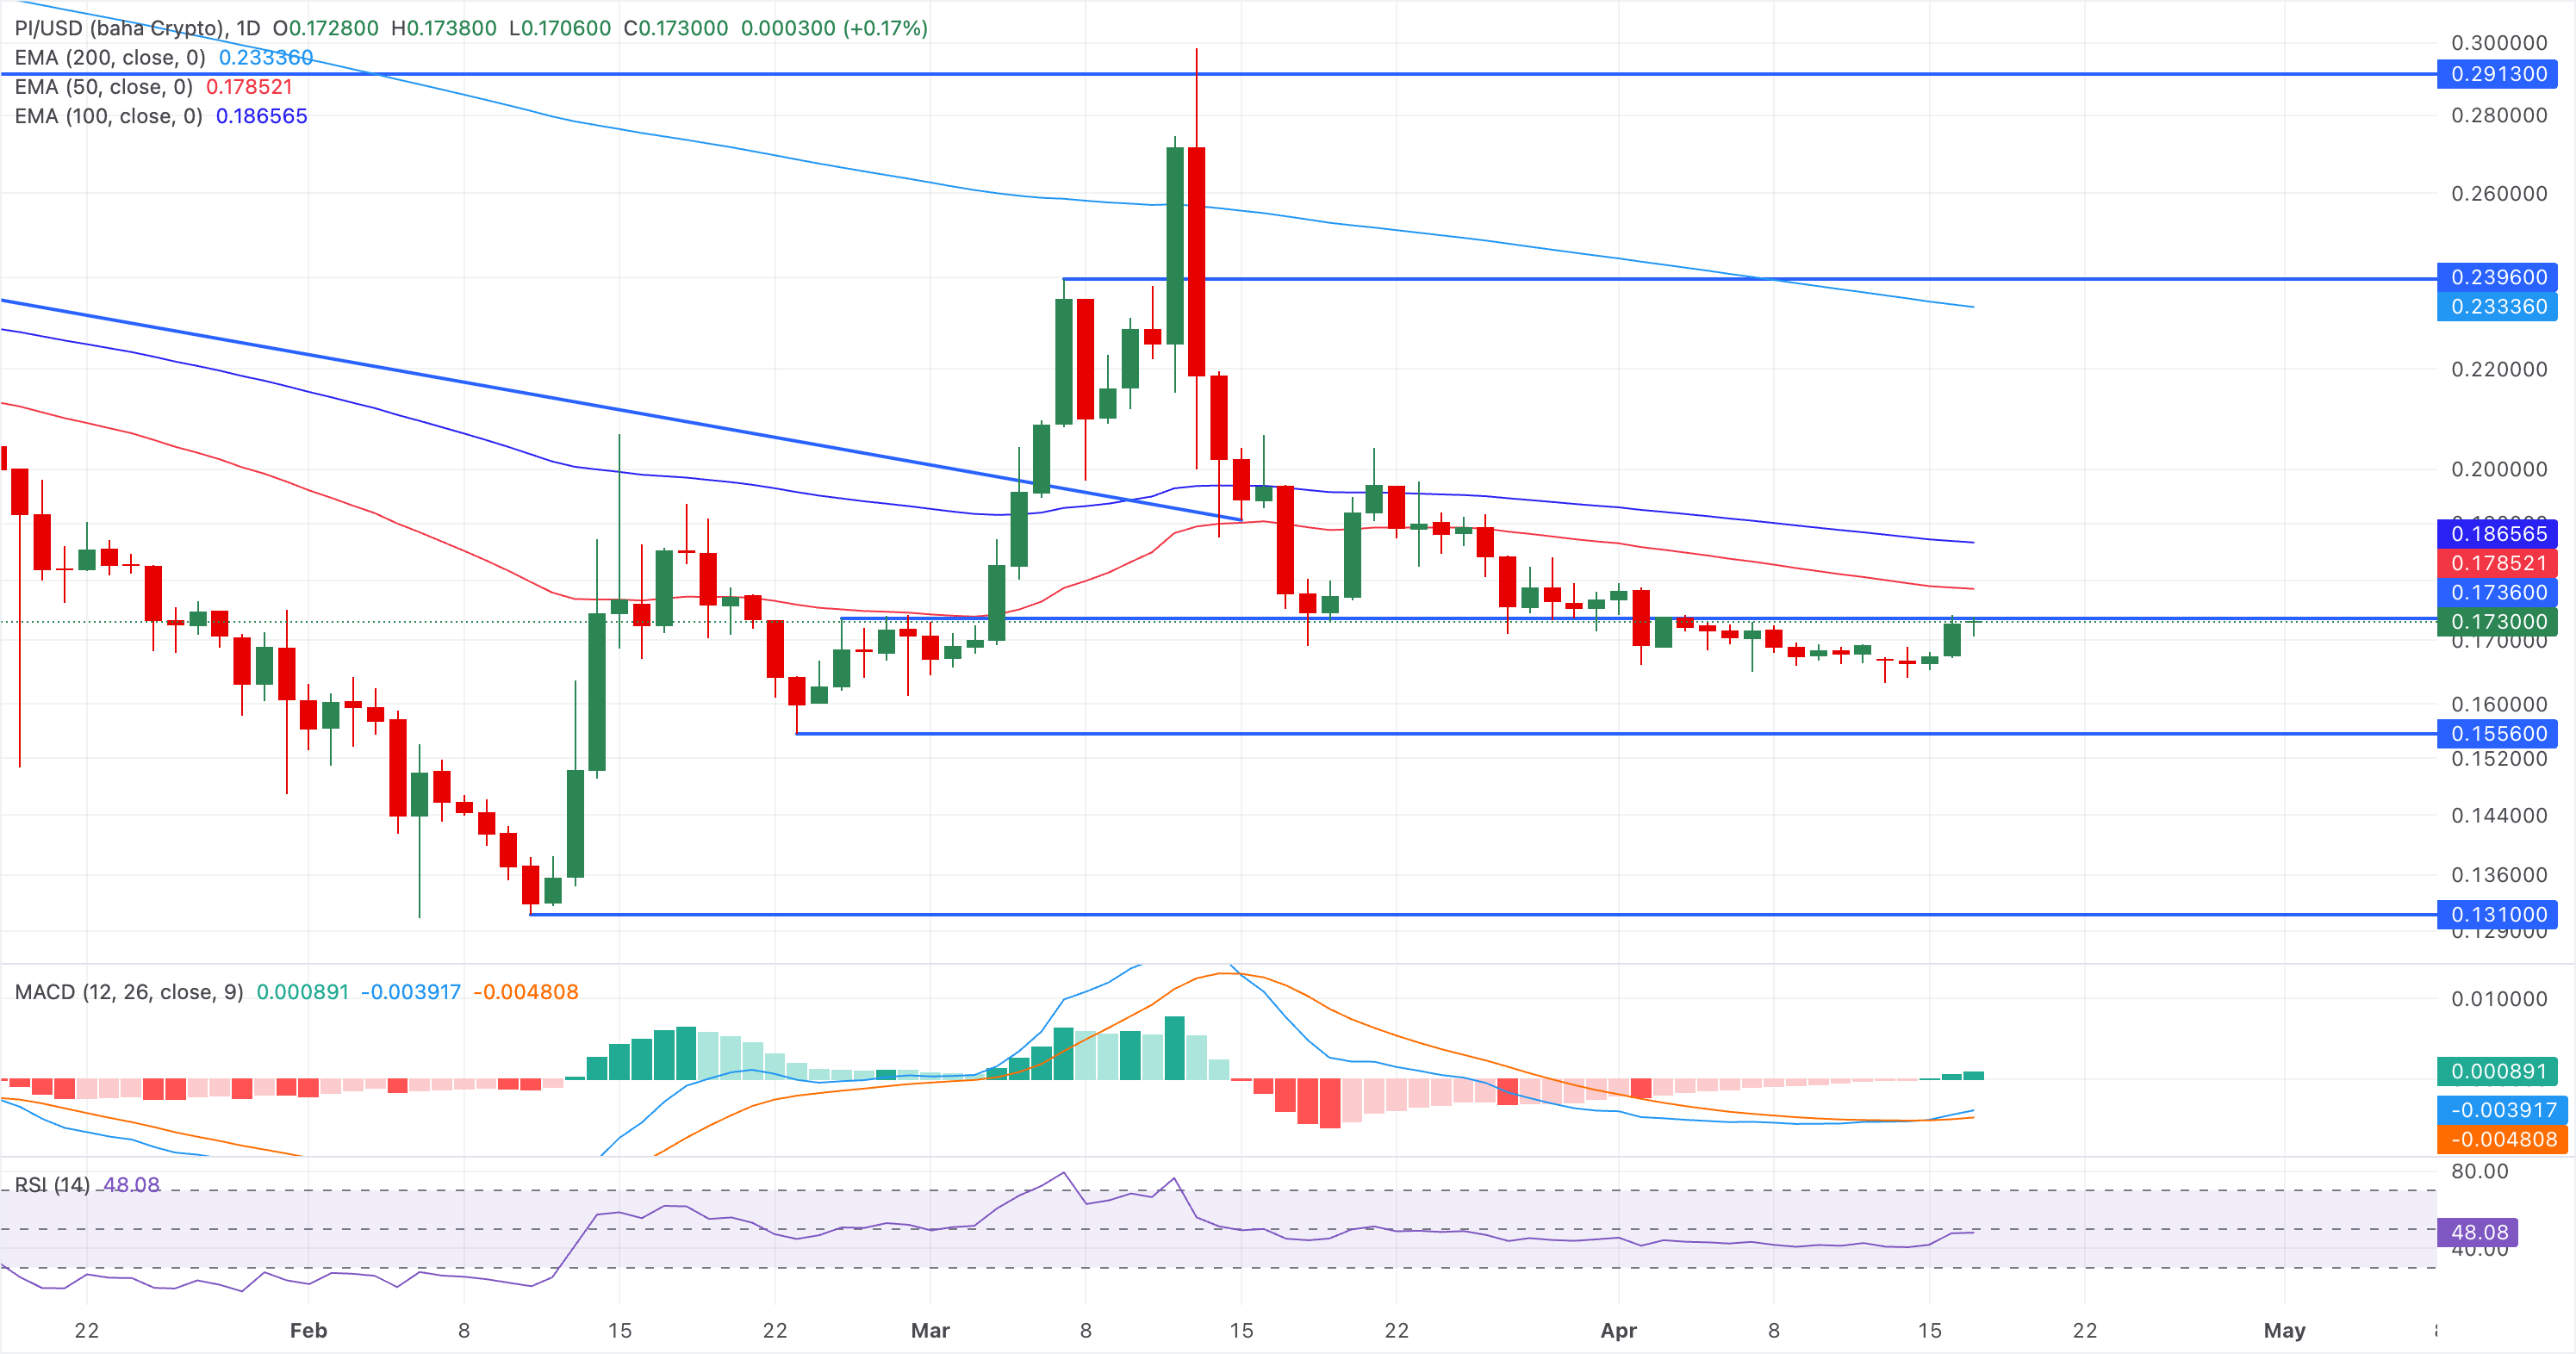
On the downside, structural support is at the February 23 low at $0.1556, and a slip below this level would expose further weakness toward the February 11 low at $0.1310.
(The technical analysis of this story was written with the help of an AI tool.)
Recommended Articles








Comments (0)
Click the $ button, enter the symbol, and select to link a stock, ETF, or other ticker.