


PEPE Flashes Selling Climax Signal, What This Means For Price



Following the historic October 10 crash, the PEPE price has been struggling against the bearish pressure. As a result, the meme coin has remained muted in terms of its price movements, with no major recoveries recently. However, it looks like the tides might be finally changing for PEPE due to the rising bullish technicals surrounding the meme coin. Crypto analyst MyCryptoParadise points this out in an analysis that focuses on the catalysts that could trigger the next PEPE rally.
The Bullish Developments Brewing A Rally For PEPE
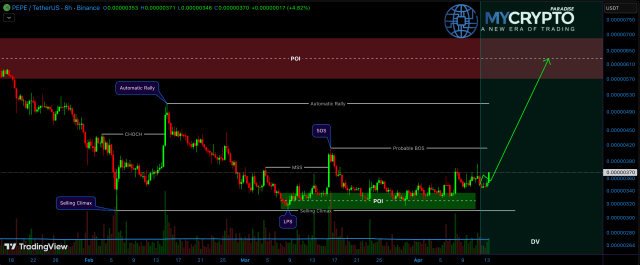
In the analyst is share don the TradingView post, MyCryptoParadise points to a number of factors that have pushed the PEPE price out of the bearish phase and into a more bullish environment. The first of these, and possibly the most important, is the fact that PEPE formed a Selling Climax (SC).
According to the analyst, this Selling Climax emerged when buying overwhelmed selling, absorbing the pressure from the dumping. The importance of this is that it means that the meme coins have now hit the end of the bearish phase. Following this, it would move right into accumulation, which is bullish for the price.
Next is the fact that PEPE saw a Change of Character with this move. This means that there is now a change from the bearish structure to a bullish one. The analyst points out that this signals that the momentum is now moving in favor of the buyers.
Another interesting formation on the chart is the Automatic Rally trend. This means that bulls are not strengthening after establishing a resistance level. Furthermore, the PEPE price has also formed a Last Point of Support. This simply means that the buyers are back in control of the meme coin once again.
Point Of Interest (POI) Formation Says A Rally Is Coming
Another major development is the Point of Interest (POI) on the PEPE chart. It has formed both a bullish and bearish POI, showing where the rally might start and a possible end. For the bullish part of this, the POI sits around $0.00000326, which could serve as the bounce-off point for the rally.
As for the bearish part of the move, the POI sits around $0.0000062, where there is a Draw on Liquidity. This is likely to be the top of the rally and the sell point following the rally. If it tops at this level, it would mean an over 60% rally for the meme coin.
Recommended Articles








Comments (0)
Click the $ button, enter the symbol, and select to link a stock, ETF, or other ticker.